
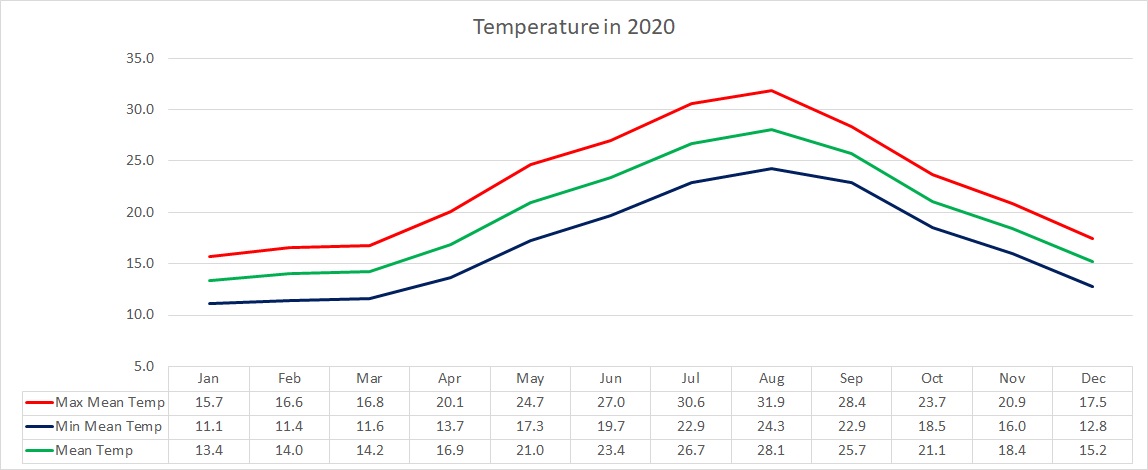
Air Temperature
| Highest Maximum | 35.8°C | 15th August 2020 |
| Lowest Maximum | 12.4°C | 6th January 2020 |
| Highest Minimum | 26.3°C | 1st August 2020 |
| Lowest Minimum | 7.3°C | 5th January 2020 |
| Mean Maximum | 22.8°C |
| Mean Minimum | 16.9°C |
| Mean | 19.8°C |
Relative Humidity
| Highest Relative Humidity | 100% | Several Days |
| Lowest Relative Humidity | 20% | 31st August 2020 |
| Mean Relative Humidity | 78.3% |
Atmospheric Pressure
| Highest Atmospheric Pressure | 1034.7hPa | 9th February 2020 |
| Lowest Atmospheric Pressure | 995.6hPa | 25th March 2020 |
| Mean Atmospheric Pressure | 1017.4hPa |
Wind
| Highest Gust | 74.0 km/h (Force 8) | 5th February 2020 |
| Mean Wind Speed | 16.8 km/h |
| Most Frequent Wind Direction | Northwest |
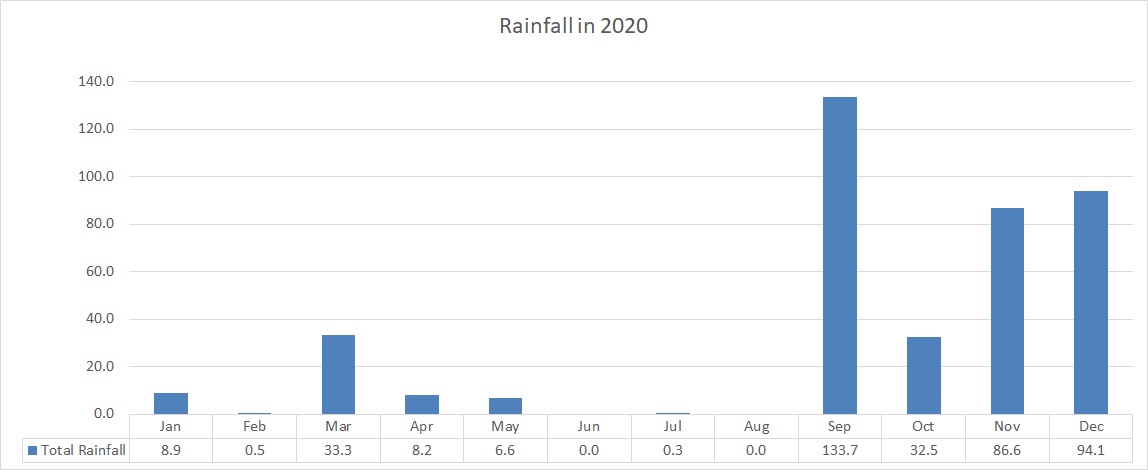
Precipitation
| Total Rainfall During 2020 | 381.7 mm |
| Highest 24 Hour Total | 112.1 mm | 14th September 2020 |
| Rain Days | 62 days |
| Thunderstorm Days | 25 days |
| Hail Days | 9 days |
Rainfall Events
| 12/01/2020 | 0.5 mm | Drizzle |
| 13/01/2020 | 5.9 mm | Isolated Showers |
| 14/01/2020 | 1.5 mm | Isolated Light Rain |
| 21/01/2020 | 1.0 mm | Isolated Light Rain |
| 05/02/2020 | 0.5 mm | Light Rain/Hail |
| 04/03/2020 | 0.5 mm | Isolated Light Rain |
| 05/03/2020 | 1.6 mm | Isolated Showers |
| 09/03/2020 | 1.4 mm | Isolated Showers |
| 10/03/2020 | 10.3 mm | Showers |
| 21/03/2020 | 0.6 mm | Isolated Light Rain |
| 24/03/2020 | 0.2 mm | Brief Light Rain/Drizzle |
| 25/03/2020 | 9.5 mm | Showers; Isolated Thunderstorm with Hail |
| 26/03/2020 | 1.6 mm | Isolated Light Rain |
| 27/03/2020 | 1.5 mm | Isolated Light Rain |
| 30/03/2020 | 6.1 mm | Showers; Persistent Drizzle |
| 02/04/2020 | 0.5 mm | Drizzle |
| 04/04/2020 | 5.9 mm | Isolated Thunderstorms |
| 20/04/2020 | 1.6 mm | Light Rain and Drizzle |
| 29/04/2020 | 0.2 mm | Drizzle |
| 27/05/2020 | TR mm | Severe Thunderstorm in Malta; Drizzle in Għarb |
| 30/05/2020 | 6.6 mm | Rain Shower |
| 20/07/2020 | 0.3 mm | Light Rain Shower |
| 06/09/2020 | 0.3 mm | Light Rain Showers; Thunderstorms at Sea |
| 07/09/2020 | TR mm | Few Spots of Rain; Isolated Thunderstorm in Malta |
| 13/09/2020 | 15.3 mm | Moderate Thunderstorm; Light Rain |
| 14/09/2020 | 112.1 mm | 4-Hour Long Heavy Thunderstorm; Hail |
| 16/09/2020 | 2.5 mm | Isolated Thunderstorm; Heavier in Malta |
| 22/09/2020 | 0.1 mm | Few Spots of Rain |
| 23/09/2020 | 1.1 mm | Isolated Shower |
| 27/09/2020 | 2.3 mm | Blustery Shower; Distant Thunder |
| 05/10/2020 | 0.5 mm | Drizzle; Distant Thunder |
| 06/10/2020 | 1.4 mm | Isolated Light Thunderstorm |
| 12/10/2020 | 3.6 mm | Frequent Light Rain |
| 13/10/2020 | 0.3 mm | Isolated Light Rain Shower |
| 19/10/2020 | 7.6 mm | Periods of Rain |
| 27/10/2020 | 12.3 mm | Thunderstorm; Brief Light Rain |
| 28/10/2020 | 6.8 mm | Heavy Rain Shower |
| 08/11/2020 | 0.1 mm | Early Drizzle |
| 15/11/2020 | 3.2 mm | Morning Shower |
| 17/11/2020 | 17.9 mm | Thunderstorm; Period of Steady Rain |
| 21/11/2020 | 13.8 mm | Isolated Showers; Thunderstorm |
| 22/11/2020 | 9.4 mm | Light Rain; Thunderstorm with Hail |
| 23/11/2020 | 6.2 mm | Showers; Distant Thunder |
| 24/11/2020 | 8.3 mm | Showers; Distant Thunder |
| 25/11/2020 | 10.8 mm | Showers; Distant Thunder |
| 26/11/2020 | 0.8 mm | Light Rain |
| 29/11/2020 | 16.1 mm | Showers; Thunderstorm |
| 02/12/2020 | 4.7 mm | Showers |
| 03/12/2020 | 6.9 mm | Showers; Distant Thunder |
| 04/12/2020 | 0.3 mm | Light Rain |
| 06/12/2020 | 2.9 mm | Showers; Distant Thunder; Hail |
| 07/12/2020 | 1.4 mm | Showers |
| 09/12/2020 | 3.6 mm | A.M. Light Rain; P.M. Thundery Rain/Hail Shower |
| 10/12/2020 | 0.7 mm | Light Rain |
| 11/12/2020 | 8.0 mm | Showers |
| 12/12/2020 | 16.0 mm | Thundery Rain/Hail Showers |
| 13/12/2020 | 1.3 mm | P.M. Shower |
| 19/12/2020 | 6.9 mm | P.M. Thunderstorm |
| 20/12/2020 | 6.8 mm | Showers; Distant Thunder |
| 21/12/2020 | 20.6 mm | Thunderstorm with Hail |
| 26/12/2020 | 1.7 mm | P.M. Isolated Shower |
| 27/12/2020 | 12.3 mm | Blustery Rain/Hail Showers |
2020 Compared to the Climate Means
| Climate Mean | 2020 | Anomaly | |
| Mean Maximum Temperature | 20.8°C | 22.8°C | +2.0°C |
| Mean Minimum Temperature | 15.6°C | 16.9°C | +1.3°C |
| Mean Temperature | 18.2°C | 19.8°C | +1.6°C |
| Mean Relative Humidity | 76% | 78.3% | +2.3% |
| Mean Atmospheric Pressure | 1016.5hPa | 1017.4hPa | +0.9hPa |
| Mean Wind Speed | 16.4 km/h | 16.8 km/h | +0.4 km/h |
| Most Frequent Wind Direction | West Northwest | Northwest | +22.5° |
| Total Rainfall | 585.6 mm | 381.7 mm | -203.9 mm |
| Total Rain Days | 84 days | 62 days | -22 days |
| Total Thunderstorm Days | 26 days | 25 days | -1 day |
| Total Hail Days | 8 days | 9 days | +1 day |
Month-by-Month Summary for 2020
January 2020 – Warmer and Drier (SECOND DRIEST ON RECORD)
February 2020 – Warmer and Drier (DRIEST ON RECORD)
March 2020 – Warmer and Drier
April 2020 – Warmer and Drier
May 2020 – Warmer and Drier (Wetter in areas due to severe thunderstorm on 27th)
June 2020 – Cooler and Drier
July 2020 – Average Temperature and Rainfall
August 2020 – Warmer and Drier
September 2020 – Warmer and Wetter
October 2020 – Cooler and Drier
November 2020 – Warmer with Average Rainfall
December 2020 – Warmer with Average Rainfall
2020: An Overall Warm and Dry Year
2020 was warmer than normal. With a mean temperature of 19.8˚C, the annual average was exceeded by 1.6˚C. The greatest difference from the climate mean was recorded in minimum temperatures. The months of June, July and October were the only ones with temperatures not above the norm. No month this year broke any temperature records. The hottest day in 2020 was to be 15th August, with a 35.8˚C maximum. On that same day, the mercury soared to 38˚C across central Malta. The coldest night of 2020 came in the first week of the year. The thermometer dipped to 7.3˚C on 5th January. A colder 5˚C was measured at the airport on the same night.
2020 was a very dry year overall. A total of 381.7 mm was measured. That is a staggering 200 mm below the climate average. January 2020 became the second driest January on record. February 2020 broke the record for the driest February ever. In fact, with just 0.5 mm of rain, it was as dry as June, July and August. By the end of June, or halfway through the year, only 57.5 mm of rain were measured. A reasonably wet autumn in the second half of 2020 eased the drought. The highest 24-hour total in 2020 was of 112.1 mm on 14th September. Much of this fell in a heavy thunderstorm that went on uninterrupted for some four hours. This value accounted for just under 30% of the year’s total rainfall. Earlier in the year, on 27th May, the central and southern stretch of Malta experienced a severe thunderstorm. There was heavy rain, large hail, damaging wind gusts and also a waterspout.
Averaging at 16.8 km/h, the wind speed conformed with the value of a typical year. A pattern worth noting was the higher frequency of windy days (Force 5 to 6), but the lower incidence of gale-force winds (Force 8 to 9). The highest gust last year was registered at 74km/h from the Northwest, during a gale on 5th February.
Overall, the average atmospheric pressure was slightly higher than the norm. The months of Janaury and February were characterised by persistent blocking anticyclones. These are areas of high pressure that remain stationary over an area for several weeks. Bringing long days of uninterrupted bright sunshine, these anticyclones were responsible for the extreme drought experienced at the start of 2020. The highest value of atmospheric pressure was recorded on the 9th of February. It reached 1034.7hPa. The lowest value of atmospheric pressure, on the other hand, was recorded on 25th March. It dropped to 995.6hPa, as an intense low pressure system traversed the central Mediterranean.
2020’s highlights were without a doubt the severe thunderstorm on 27th May and the heavy thunderstorm on 14th September.
At least two thunderstorms drenched Malta on 27th May. The second of these, which struck in afternoon, was confirmed as having been severe. It produced wind gusts of up to Force 8 (over 62 km/h), hailstones with a diameter of around 2.5 centimetres (the size of a €2 coin) and a confirmed waterspout (dissipated over the beach) close to Armier Bay. Total rainfall ranged from 6.4 mm (Birżebbuġa) to 41.2 mm (Għargħur). On the day, an upper-level low pressure system over the central Mediterranean brought relatively cold air from the Balkans over a warm central Mediterranean, creating a great deal of instability with towering cumulus and cumulonimbus clouds that sparked heavy showers and thunderstorms. The wind was very light at all levels of the troposphere, allowing the storms to build up gradually as a result of diurnal heating. Colder air in the upper levels of the atmosphere increases instability. This is because the warmer air at ground level, being lighter and more buoyant, tends to rise. This vertical movement cools the rising air, causing the moisture within to condense and form clouds.
Around mid-September, at least four main thunderstorms struck the Maltese Islands. The first came in the early afternoon of Saturday 12/09. This drenched central and southern Malta. With 67.2 mm of rain, Luqa was the wettest locality. The second thunderstorm occurred in the morning on Sunday 13/09. This affected areas further north. Nadur and Mellieħa found themselves at the centre of this storm, with rainfall values of 40 mm each. The third and most intense storm struck at noon on Monday 14/09. It packed rainfall rates of up to 167 mm / hr, gale force winds and dangerous cloud-to-ground lightning. The island of Gozo bore the brunt of it all. It had to endure nothing less than four hours of torrential rain. In the end, the localities of Għarb and Xagħra had received the most rainfall, with 112.1 mm and 102.0 mm respectively. The 112.1 mm total from Għarb is equal to 1/5 of a typical year’s rain and almost three times the typical September’s rain. The sea surface temperature around the Maltese Islands last summer peaked at 29⁰C, a full 2⁰C warmer than the average. The high sea surface temperature contributed to increased rates of evaporation, which in turn, led to an increase in humidity levels. Around that time, a short-wave upper-level low pressure system passed across our region bringing relatively cold air over a very warm sea. This created a great deal of instability. In addition to this, a greater amount of moisture was available to be advected into these thunderstorms. The end product were the thunderstorms with intense rainfall. The absence of wind aloft meant that the entire zone of instability, along with all the individual thunderstorms within it, were extremely slow-moving. This exacerbated further the amount of rainfall dumped by the storms.
0 comments
Write a comment