2025: A Year Marked by Warmer and Wetter Conditions
Air Temperature
| Highest Maximum | 37.7°C | 25th July 2025 |
| Lowest Maximum | 12.9°C | 14th January 2025 |
| Highest Minimum | 26.2°C | 21st August 2025 |
| Lowest Minimum | 5.6°C | 16th January 2025 |
| Mean Maximum | 23.5°C |
| Mean Minimum | 16.5°C |
| Mean | 19.9°C |
Relative Humidity
| Mean Relative Humidity | 79.4% |
Atmospheric Pressure
| Highest Atmospheric Pressure | 1032.2hPa | 20th March 2025 |
| Lowest Atmospheric Pressure | 1000.9hPa | 1st April 2025 |
| Mean Atmospheric Pressure | 1017.0hPa |
Wind
| Highest Gust | 59.5 km/h (Force 7) | 23rd March 2025 |
| Mean Wind Speed | 9.5 km/h |
| Most Frequent Wind Direction | Northwest |
Precipitation
| Total Rainfall During 2025 | 631.5 mm |
| Highest 24 Hour Total | 60.4 mm | 24th September 2025 |
| Rain Days | 75 days |
| Thunderstorm Days | 30 days |
| Hail Days | 11 days |
Rainfall Events
| 2/1/2025 | 0.0 mm | Distant Isolated Light Rain |
| 3/1/2025 | 0.0 mm | Distant Isolated Showers |
| 4/1/2025 | 0.0 mm | Distant Isolated Showers |
| 8/1/2025 | 0.8 mm | Light Rain |
| 12/1/2025 | 3.5 mm | A.M. Shower |
| 13/1/2025 | 12.3 mm | P.M. Heavy Rain |
| 14/1/2025 | 10.1 mm | Showers; Distant Thunder |
| 15/1/2025 | 1.0 mm | P.M. Shower |
| 16/1/2025 | 6.2 mm | A.M. Isolated Shower; P.M. Steady Rain |
| 17/1/2025 | 10.2 mm | A.M. Steady Rain; P.M. Thunderstorm with Hail |
| 18/1/2025 | 0.0 mm | Distant Light Rain |
| 20/1/2025 | 0.0 mm | Distant Isolated Showers |
| 21/1/2025 | 0.0 mm | Distant Isolated Showers |
| 29/1/2025 | 8.7 mm | Light to Moderate Rain; Distant Thunder |
| 30/1/2025 | 0.0 mm | Distant A.M. Light Rain |
| 3/2/2025 | 0.5 mm | Isolated Showers; Distant Thunder and Hail |
| 5/2/2025 | 0.0 mm | Distant Isolated Light Rain |
| 6/2/2025 | 0.0 mm | Distant Isolated Light Rain |
| 7/2/2025 | 8.0 mm | Rain Showers |
| 8/2/2025 | 15.7 mm | Rain Showers |
| 9/2/2025 | 21.6 mm | Steady Rain; Thunderstorm |
| 10/2/2025 | 6.3 mm | Rain Showers |
| 14/2/2025 | 0.0 mm | Distant Hailstorm with Large Hail |
| 15/2/2025 | 2.3 mm | Rain Showers |
| 16/2/2025 | 0.5 mm | Isolated Showers |
| 19/2/2025 | 0.6 mm | P.M. Isolated Showers |
| 20/2/2025 | 4.2 mm | A.M. Showers; Distant Steady Heavy Rain |
| 22/2/2025 | 1.3 mm | A.M. Isolated Shower |
| 26/2/2025 | 2.1 mm | P.M. Light Rain; Showers; Distant Thunder |
| 27/2/2025 | 2.9 mm | Showers; Distant Hail |
| 4/3/2025 | 6.4 mm | A.M. Shower |
| 5/3/2025 | 0.2 mm | Isolated Light Rain |
| 6/3/2025 | 0.5 mm | Isolated Light Rain |
| 7/3/2025 | 33.2 mm | Continuous Rain |
| 8/3/2025 | 0.0 mm | Distant Isolated Light Rain |
| 23/3/2025 | 0.5 mm | Isolated Light Rain with Dust |
| 24/3/2025 | TR mm | Distant Isolated Light Rain with Dust |
| 25/3/2025 | 8.5 mm | A.M. Isolated Thunderstorm; Showers |
| 26/3/2025 | 21.7 mm | A.M. Steady Rain; Distant Thunder |
| 27/3/2025 | 0.8 mm | Isolated Thundery Showers |
| 28/3/2025 | 1.6 mm | Isolated Thundery Showers |
| 29/3/2025 | 2.0 mm | Isolated Showers |
| 30/3/2025 | 2.6 mm | Isolated Showers |
| 1/4/2025 | 0.9 mm | Isolated Shower; Distant Thunderstorms |
| 7/4/2025 | 0.3 mm | A.M. Isolated Light Rain |
| 29/4/2025 | 31.1 mm | A.M. Thunderstorms with Hail |
| 6/5/2025 | 1.4 mm | A.M. Thunderstorms |
| 9/5/2025 | 2.8 mm | Thunderstorm |
| 15/5/2025 | 29.0 mm | Showers; Distant Thunder; P.M. Thunderstorm |
| 16/5/2025 | 0.3 mm | A.M. Isolated Shower |
| 25/5/2025 | 1.8 mm | A.M. Isolated Showers |
| 20/6/2025 | 22.5 mm | P.M. Downpours |
| 16/8/2025 | 0.0 mm | Distant P.M. Thunderstorm |
| 17/8/2025 | 0.5 mm | A.M. Thunderstorm |
| 29/8/2025 | TR mm | Isolated Light Rain |
| 24/09/2025 | 60.4 mm | Afternoon Isolated Thunderstorm; Evening Thunderstorm |
| 26/09/2025 | 0.0 mm | Distant Isolated Light Rain; Distant Thunder |
| 27/09/2025 | 37.1 mm | Morning Thunderstorm; Afternoon Thunderstorm with Hail |
| 29/09/2025 | 2.6 mm | Afternoon Isolated Shower |
| 01/10/2025 | 18.0 mm | Afternoon Thunderstorm; Evening Thundery Showers |
| 02/10/2025 | 0.0 mm | Morning Distant Isolated Showers |
| 13/10/2025 | 29.5 mm | Morning Thunderstorm |
| 14/10/2025 | 0.8 mm | Isolated Shower |
| 15/10/2025 | 26.1 mm | Afternoon Thunderstorm with Hail |
| 16/10/2025 | 11.9 mm | Morning Thunderstorm |
| 18/10/2025 | 13.5 mm | Steady Rain; Intermittent Evening Thunder |
| 19/10/2025 | 0.0 mm | Morning Distant Isolated Showers |
| 01/11/2025 | 0.0 mm | Distant Isolated Showers |
| 02/11/2025 | 0.0 mm | Distant Isolated Showers |
| 03/11/2025 | 4.3 mm | Isolated Showers |
| 07/11/2025 | 0.0 mm | Distant Downpours |
| 09/11/2025 | 1.5 mm | Isolated Showers |
| 10/11/2025 | 0.0 mm | Distant Isolated Showers |
| 18/11/2025 | 1.5 mm | Evening Light Rain |
| 19/11/2025 | 0.3 mm | Morning Light Rain |
| 21/11/2025 | 2.6 mm | Morning Shower |
| 22/11/2025 | 7.6 mm | Morning and Evening Rain/Hail Showers |
| 23/11/2025 | 2.3 mm | Isolated Showers |
| 24/11/2025 | 0.0 mm | Distant Light Rain |
| 26/11/2025 | 10.3 mm | Periods of Rain; Distant Lightning |
| 27/11/2025 | 3.4 mm | Rain/Hail Showers with Thunder; Distant Hailstorms |
| 28/11/2025 | 1.0 mm | Isolated Light Rain; Distant Rain/Hail Showers |
| 29/11/2025 | 0.3 mm | Morning Isolated Shower |
| 30/11/2025 | 0.0 mm | Distant Isolated Shower |
| 03/12/2025 | 5.4 mm | Morning Rain |
| 04/12/2025 | 8.8 mm | Rainy; Isolated Rain/Hail Showers; Distant Thunder |
| 05/12/2025 | 6.0 mm | Rainy; Distant Hailstorm; Distant Thunder |
| 06/12/2025 | 0.0 mm | Distant Isolated Shower |
| 09/12/2025 | 0.3 mm | Heavy Dewfall |
| 10/12/2025 | 0.3 mm | Heavy Dewfall |
| 11/12/2025 | 0.3 mm | Heavy Dewfall; Distant Localized Morning Downpour |
| 12/12/2025 | 0.3 mm | Heavy Dewfall |
| 16/12/2025 | 10.6 mm | Morning Steady Rain |
| 19/12/2025 | 12.7 mm | Morning Isolated Showers; Evening Steady Rain |
| 20/12/2025 | 25.5 mm | Morning Steady Rain |
| 21/12/2025 | 19.4 mm | Periods of Rain |
| 22/12/2025 | 0.3 mm | Evening Isolated Shower |
| 23/12/2025 | 0.5 mm | Isolated Showers |
| 24/12/2025 | TR mm | Drizzle; Distant Evening Isolated Showers |
| 25/12/2025 | 0.0 mm | Distant Morning Isolated Showers |
| 27/12/2025 | 2.9 mm | Isolated Showers |
| 29/12/2025 | 3.3 mm | Isolated Showers |
| 31/12/2025 | 12.5 mm | Thunderstorms; Rain/Hail Showers; Distant Hailstorm |
2025 Compared to the Climate Means
| Climate Mean | 2025 | Anomaly | |
| Mean Maximum Temperature | 22.9°C | 23.5°C | +0.6°C |
| Mean Minimum Temperature | 16.0°C | 16.5°C | +0.5°C |
| Mean Temperature | 19.5°C | 19.9°C | +0.4°C |
| Mean Relative Humidity | 75.7% | 79.4% | +3.7% |
| Mean Atmospheric Pressure | 1016.5hPa | 1017.0hPa | +0.5hPa |
| Mean Wind Speed | 14.1 km/h | 9.5 km/h | -4.6 km/h |
| Most Frequent Wind Direction | West Northwest | Northwest | +22.5° |
| Total Rainfall | 531.4 mm | 631.5 mm | +100.1 mm |
| Total Rain Days | 84 days | 75 days | -9 days |
| Total Thunderstorm Days | 30 days | 30 days | / |
| Total Hail Days | 10 days | 11 days | +1 day |
Month-by-Month Summary for 2025
January 2025 – Warmer and Drier
February 2025 – Warmer and Wetter
March 2025 – Warmer and Wetter
April 2025 – Average Temperatures and Wetter
May 2025 – Warmer and Wetter
June 2025 – Warmer and Wetter
July 2025 – Average Temperatures and Rainfall
August 2025 – Cooler and Drier
September 2025 – Average Temperatures and Wetter
October 2025 – Cooler and Wetter
November 2025 – Average Temperatures and Drier
December 2025 – Warmer and Wetter
2025: A Year Marked by Warmer and Wetter Conditions
Half of the year was marked by warmer than average temperatures. Four of the remaining six months registered temperatures in check with the climate norm. Two months were markedly cooler than the norm. The months closer to the norm were distributed across the second half of summer and all of autumn. In a stark contrast to the trend set in recent years, and to the relief of many, precipitation exceeded the climate norm in a total of eight months. Another month recieved rainfall in conformity with the average. The only drier than average months were January, August and November.
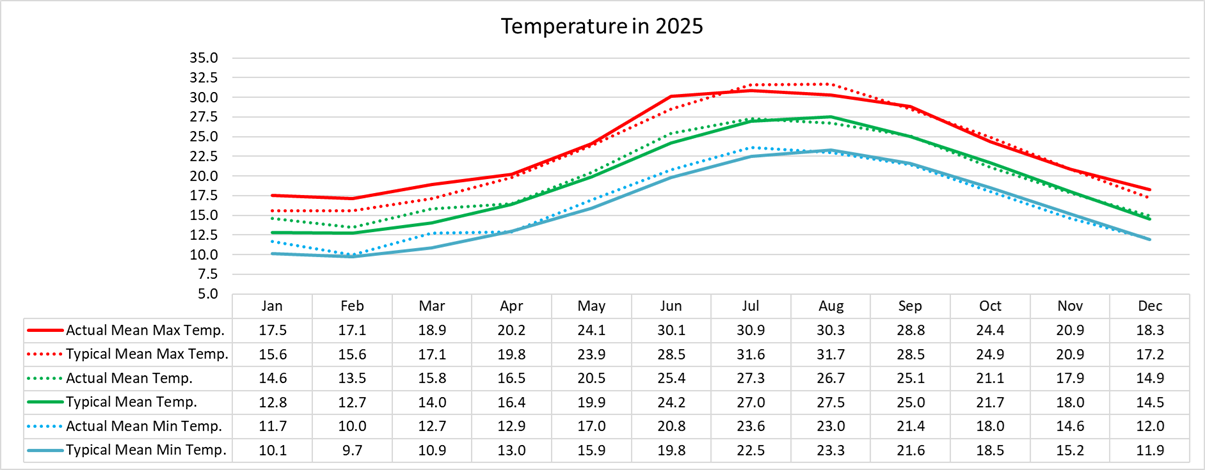
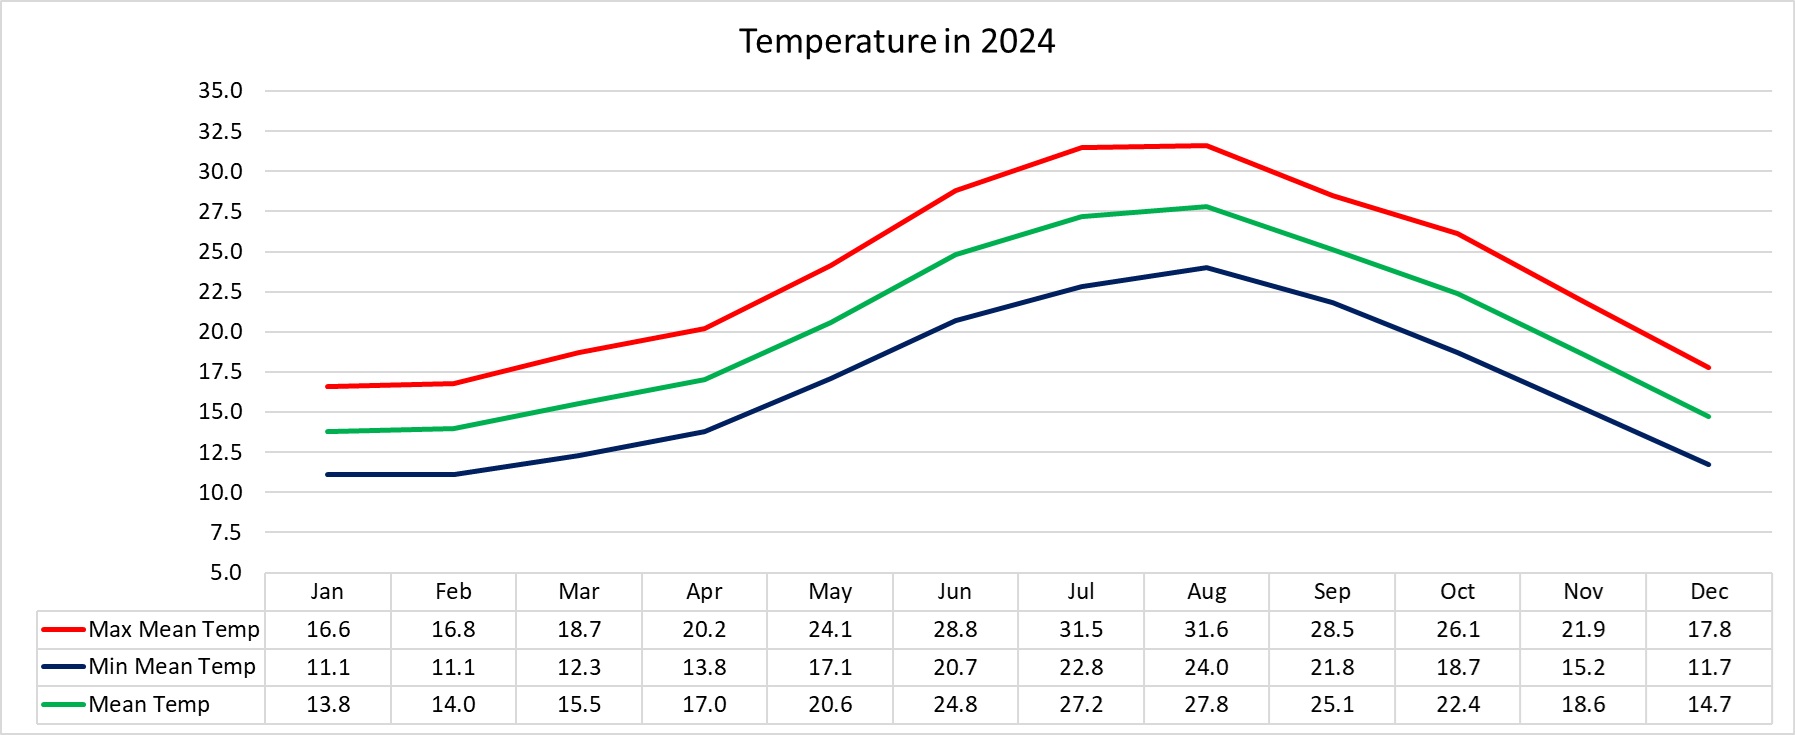
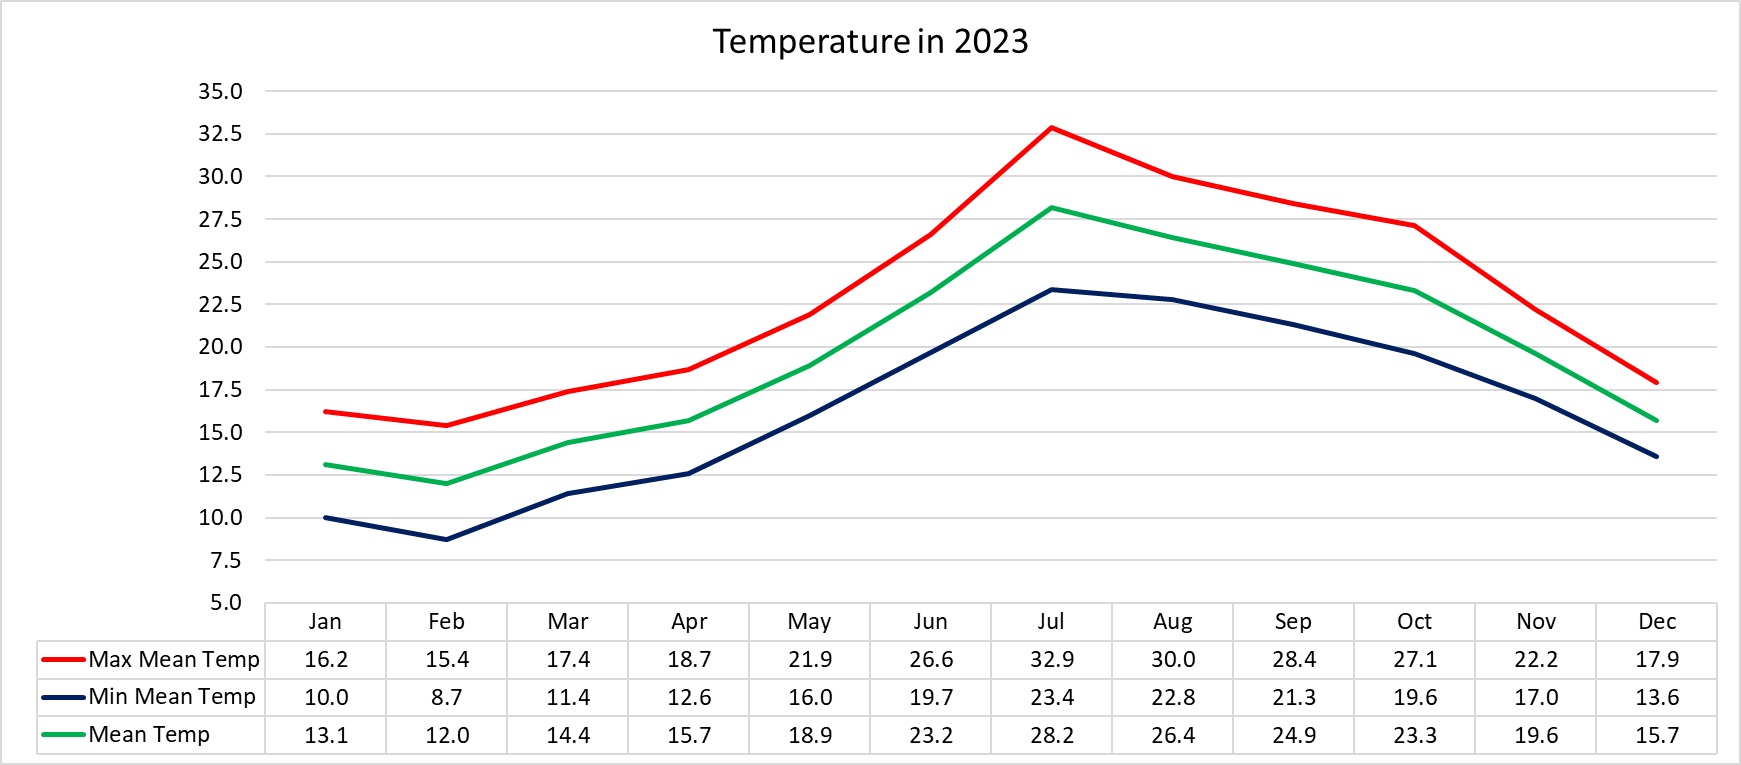
Overall, the year 2025 was 0.4˚C warmer than the norm. Mean maximum and mean minimum temperatures surpassed the average by 0.6˚C and 0.5˚C respectively. The early onset of upper level instability in late summer contributed towards abundant autumnal instability which in turn resulted in cooler temperatures across the region.
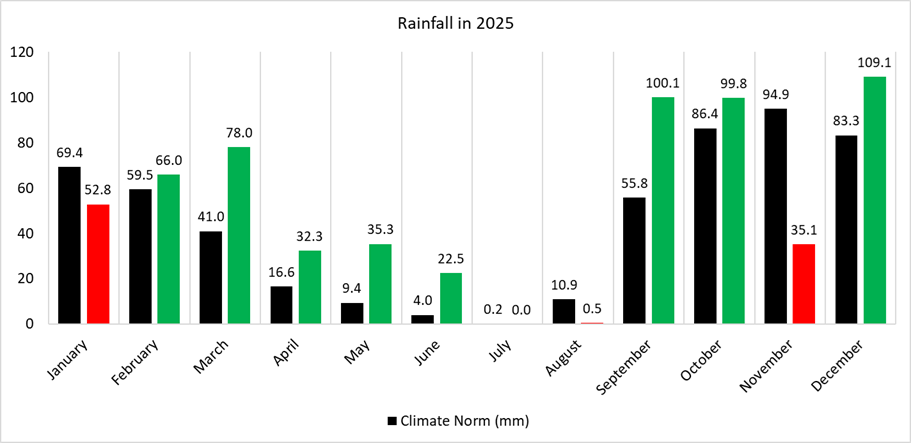
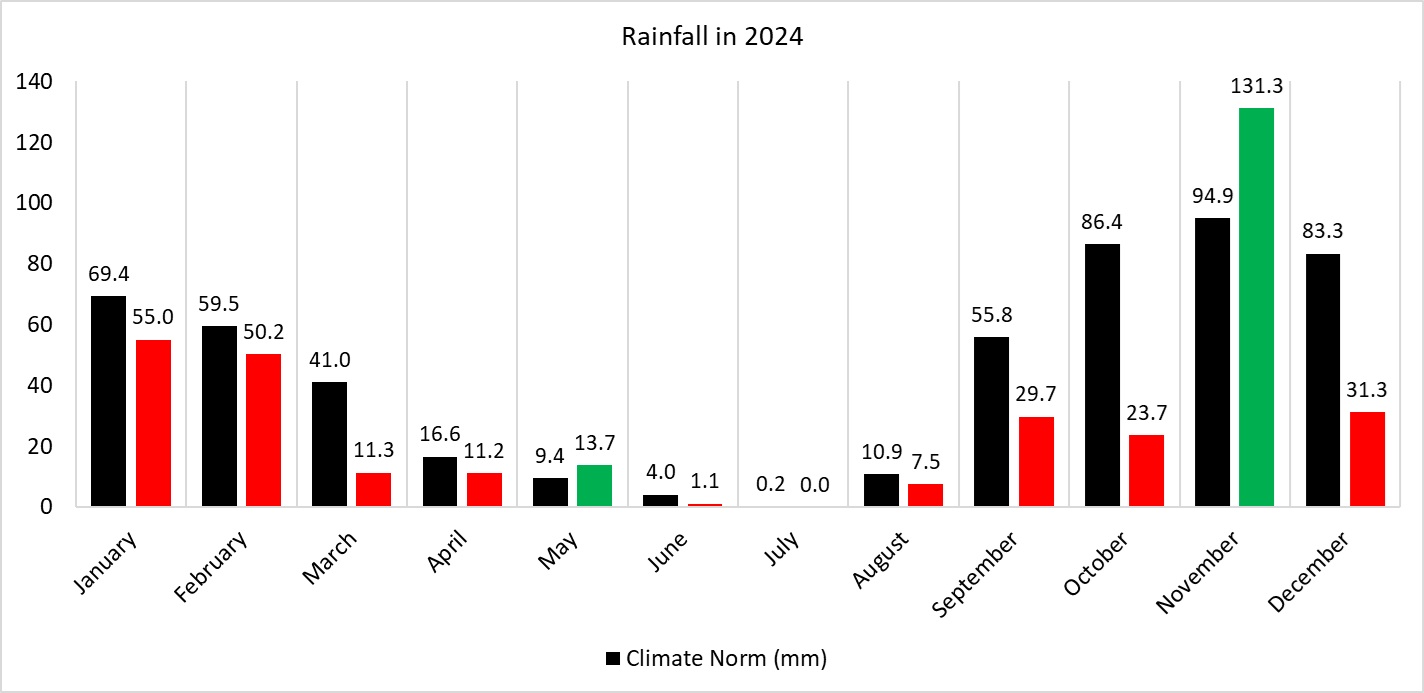
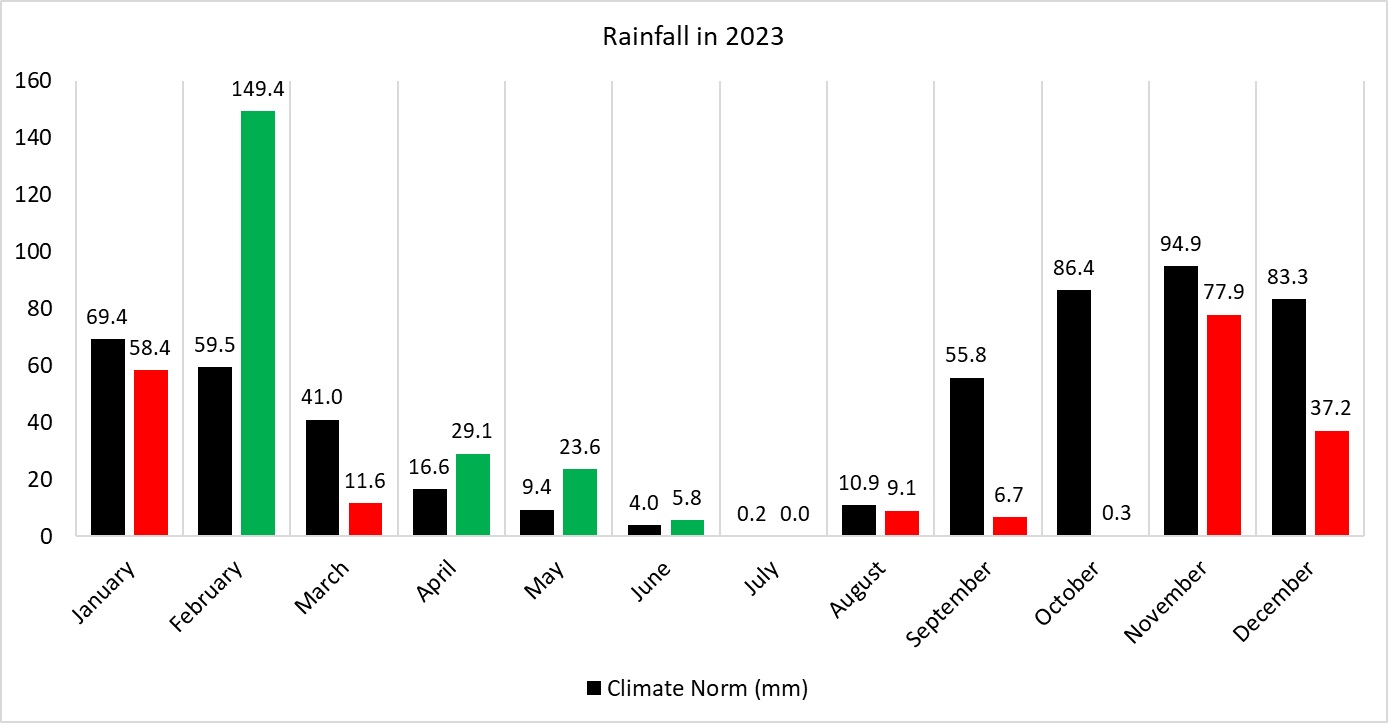
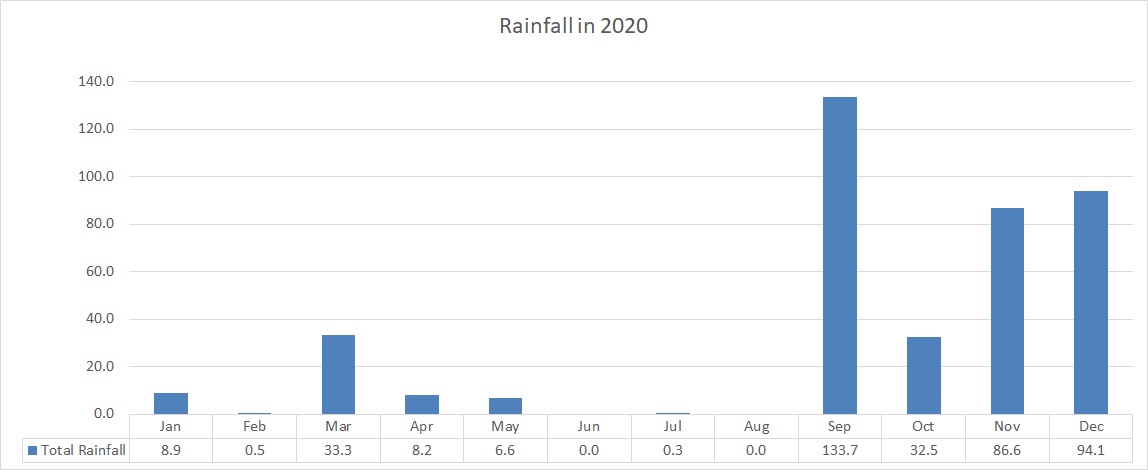
2025 was the first year since 2021 to register more rainfall than is expected. It was also only the fourth wetter than average year since 2010. With a total of 631.5 mm of rain, 2025 was also the wettest since 2012. The year was characterized by a good late wet winter and a long, rainy spring which extended right until the start of summer. Autumn drew a great contrast between the two islands. Downpours drenched Gozo but missed Malta almost entirely. Whilst Malta failed to enjoy a wet autumn month, the stormy weather only failed to reach Gozo in November. December was dotted with rainy days, helping it become the first one with more rainfall than the norm in eleven years! The 100 mm mark was reached on three months. The highest 24-hour rainfall total was reported on 24th September, when an afternoon isolated thunderstorm and an evening thunderstorm drenched Gozo with 60.4 mm of rain.
Almost half of all days (15) in January were characterized by at least one shower over one area or another of the Maltese Islands. Despite these days of rain, January’s total precipitation of 63.0 mm was less than the value for a typical January. Total rainfall at our weather station was an even lower 52.8 mm. Apart from being drier than the climate norm, the month was also warmer than expected at this time of year. In fact, it was among the warmest Januarys ever. The mean temperature of 14.6°C exceeded the climate average by 1.8°C. These temperatures are more typical of Easter time rather than the peak of winter! Rainfall totals bounced back in February. Whilst all corners of the Maltese Islands registered a wetter than average February 2025, it was the island of Malta which benefitted most from the rainfall recovery. Localities in Malta received approximately 103.2 mm over the course of February 2025. Gozitan localities, on the other hand, received only 65.2 mm. This was because most rain-bearing systems came to our islands with easterly currents. These affect Malta far more than Gozo. The highlight was a hailstorm with large hailstones over the southern half of Malta, particularly Birżebbuġa and Għaxaq, on Valentine’s Day. Temperatures in winter depend on the so-called polar vortex. This is a circulation of very cold air in the Arctic. This winter we’ve seen the polar vortex assume a stronger and more compact structure, leading to cold air remaining locked up and restricted to polar areas. It was so strong, in fact, that the temperature at the level of 30,000 above the Arctic dropped to -90°C (the coldest for the past 40 years).
March brought with it the dominance of Scirocco winds. A staggering 18 days were dominated by winds from the Southeasterly quadrant. Winds from these directions, referred to collectively as Scirocco are common in the springtime, but their dominance this March was greater than normal. Their prevalence impacted on the local weather in several ways. At 15.8°C, mean temperatures were a staggering 1.8°C warmer than normal. The month’s warmest temperature was measured on the evening of the 23rd. Measured at 26.8°C, this was during one of several heat bursts noted over the month. Starting soon after 18:30, the air temperature rose rapidly from around 16.9°C to 26.8°C in a space of just a few minutes. Levels of relative humidity also experienced a sharp drop, from a humid 92% to an extremely dry 40%, all in a gap of a few minutes. In typical heat burst fashion, the wind increased dramatically from a lull to gale-force in a matter of minutes. A total of 78.0 mm of rainfall was measured at our weather station in Gozo. Spread over 12 days, this rainfall continued the recovery from a dry start to the rainfall year. The plentiful rainfall was the result of successive low-pressure systems from over north Africa. Having featured only a handful of showers over two separate days, April 2025 was relatively dry until the final few days. A zone of instability coupled with cold air aloft and an absence of wind at all levels of the atmosphere allowed for the formation of an area of thunderstorms around the central Mediterranean. Gozo was affected by a series of three thunderstorms in the hours between midnight and dawn on the 29th. The extreme west, southwest and south coasts of Malta were struck by one in the morning. This made for some very loud and frequent thunder which is more often synonymous with the autumn months. Hail was also observed in some localities. This meteorological event was probably the only one thing that stood out from an otherwise normal month. May was a mixed bag of spring weather. As spring settled in across the Maltese Islands, May was characterized by a mix of pleasant weather and occasional instability, including a day of intense thundery downpours. 35.3 mm of rain was recorded at our weather station in May. This was almost four times the climate norm. A staggering 29 mm of it fell in one day. This was from a series of thundery downpours which affected all the Maltese Islands on the 15th. The 15th also accounted for the month’s highest wind gust. Copious amounts of fine desert sand were deposited by the lighter thunderstorms spread around the month.
June was off to a comfortable start. This lasted only briefly, however, as the heat of summer quickly turned up on the 7th. Large swathes of western Europe were affected by a particularly intense heat wave. In addition to this, the entire Mediterranean basin experienced an incredible lack of wind, widespread calm sea and uninterrupted blazing sunshine for much of June. June brought with it one day of rain. Rainfall was in the form of localized downpours, over the central and northern coasts of both Malta and Gozo. These showers, which affected only localized areas, lasted for a long while. Victoria, in Gozo, recorded up to 26.9 mm on that day. Other than two heat spells; one towards the beginning and another towards the end, July was relatively merciful. This could be due to an elevated relative humidity. Elevated humidity prevents temperatures from shooting up during the day. The main contributor to the greater humidity was the very warm sea. A downpour across parts of the Maltese Islands on the eve of summer solstice was also a contributing factor. Outbreaks of days with a breezy North-westerly wind also ensured that temperatures didn’t get too hot for too long. July 2025 also lived up to its expectation of being a completely dry month. No rain made it to the Maltese Islands throughout. The third and final month of meteorological summer confirmed this year’s summer as a very forgiving one temperature-wise, but rather uncomfortable with regards to relative humidity. No intense heat spells were registered over the course of the month. The days following the public holiday on the 15th lived up to their expectation of bringing to our shores some rain-bearing clouds. What started as a zone of instability over Sicily quickly spread south across the central Mediterranean. Two separate thunderstorms struck parts of the Maltese Islands: one in the afternoon hours of the 16th and another in the predawn hours of the 17th. The second thunderstorm, which struck in the dark hours, produced a beautiful display of lightning. On a separate occasion, southerly currents on the 29th brought with them overcast skies, a trace of rainfall and a dusting of desert sand.
Temperatures in the first month of meteorological autumn were around average for the time of year. September was completely dry up until the 23rd. The first wave of autumn instability arrived late and lasted for much of the final week of September 2025. The 24th and the 27th were particularly stormy; producing 97.5 mm of the 100.1 mm measured at our Gozo weather station. Whilst Gozo experienced flash flooding in the usual localities on both days, Malta was left largely untouched by the heavy downpours on those days. The thunderstorm on the 27th brought a so-called ‘microburst’ (sudden torrential rain accompanied by strong wind) to localities across the southern half of Gozo. October, the second month of meteorological autumn, was marked by a mean temperature 0.5°C below the climate norm. This can be attributed to the cooling effect of the abundant autumn rain in Gozo. October followed the rainfall pattern set in the previous month. Whilst Gozo closed off the month with a mean precipitation total of 82.1 mm, Malta lagged further behind with a tally of 62.5 mm. This discrepancy is compounded when considering totals since September 1st; Gozo’s tally standing at almost 200 mm with Malta less than half that at 78 mm! It is a well-known fact in local meteorology that Gozo is often hit harder by autumn thunderstorms than Malta. Although with a difference of just a few kilometres, Gozo lies slightly further north and is therefore more exposed to incoming storm systems from the sea. Warm waters around the island help fuel storms, and its slightly higher, more open landscape can enhance their intensity. Storm tracks frequently pass over Gozo before reaching Malta, meaning storms may weaken by the time they hit the main island. The 6 days of rain and 5 days on which thunder was heard are both short of the norm. This confirms that the fewer zones of instability which developed across the central Mediterranean were particularly intense. Whilst days of instability dotted all of November, and days of rain around the Maltese Islands exceeded the climate norm of 11 days, total precipitation was less than half the typical value for this month of the year. This could be put down to the fact that most zones of instability failed to reach a prominent level of intensity. Also, most localities missed out on a handful of downpours which developed around us. From a regional perspective, November was a fairly typical month. Localities in Malta, particularly to the south, were the recipients of a downpour on the 7th and a hailstorm on the 27th. These two rainfall events are what made a difference for a handful of localities. Hail was observed on three days. It was large and in abundance on two occasions. This can be attributed to the earlier than usual advection of cold air from the north towards the central Mediterranean. Temperatures were overall close to the norm in what is turning out to be a rather seasonal autumn.
December 2025 was the first one in eleven years to bring more rainfall than the climate norm to our shores. This rainfall was the product of three main weather systems: towards the beginning of the month, in the week before Christmas and the closing days of the year. Hailstorms on the 5th and the 31st were the month’s highlights. Central Malta was the hardest hit on both occasions. The Scirocco wind dominated the month. Standing at a mean of 18.3°C, maximum temperatures exceeded the climate norm by a significant 1.1°C. It is a direct result of warm air being advected to the central Mediterranean from north Africa. The absence of cold air incursions from northern Europe, however, meant that even the coldest night last month registered a mild minimum temperature of 9.1°C.