
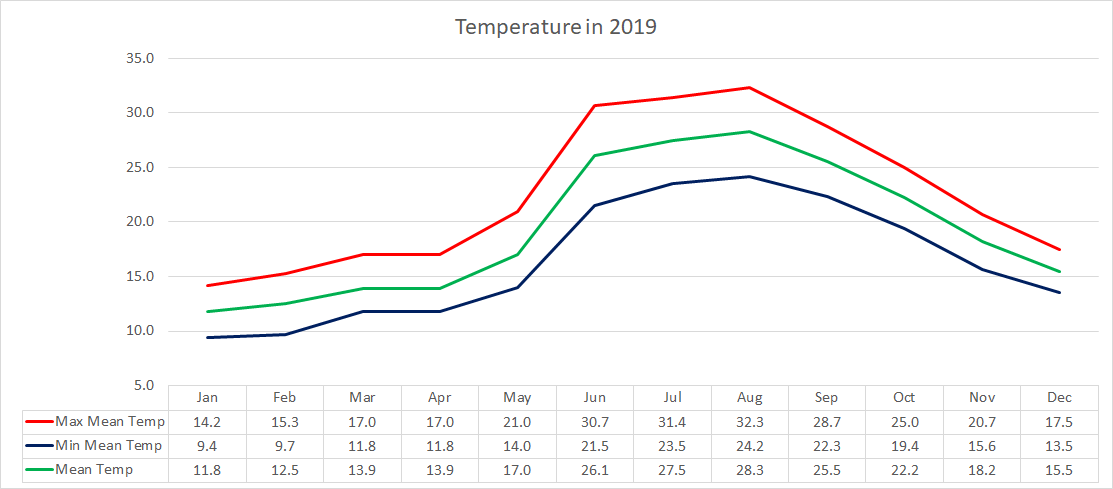
Air Temperature
| Highest Maximum | 38.3°C | 9th July 2019 |
| Lowest Maximum | 10.6°C | 4th January 2019 |
| Highest Minimum | 26.2°C | 9th July 2019 |
| Lowest Minimum | 3.9°C | 23rd February 2019 |
| Mean Maximum | 22.6°C |
| Mean Minimum | 16.4°C |
| Mean | 19.5°C |
Relative Humidity
| Highest Relative Humidity | 100% | Several Days |
| Lowest Relative Humidity | 14% | 9th July 2019 |
| Mean Relative Humidity | 63.8% |
Atmospheric Pressure
| Highest Atmospheric Pressure | 1030.5hPa | 14th February 2019 |
| Lowest Atmospheric Pressure | 987.1hPa | 25th January 2019 |
| Mean Atmospheric Pressure | 1016.2hPa |
Wind
| Highest Gust | 101.0 km/h (Force 10) | 24th February 2019 |
| Mean Wind Speed | 16.2 km/h |
| Most Frequent Wind Direction | West Southwest |
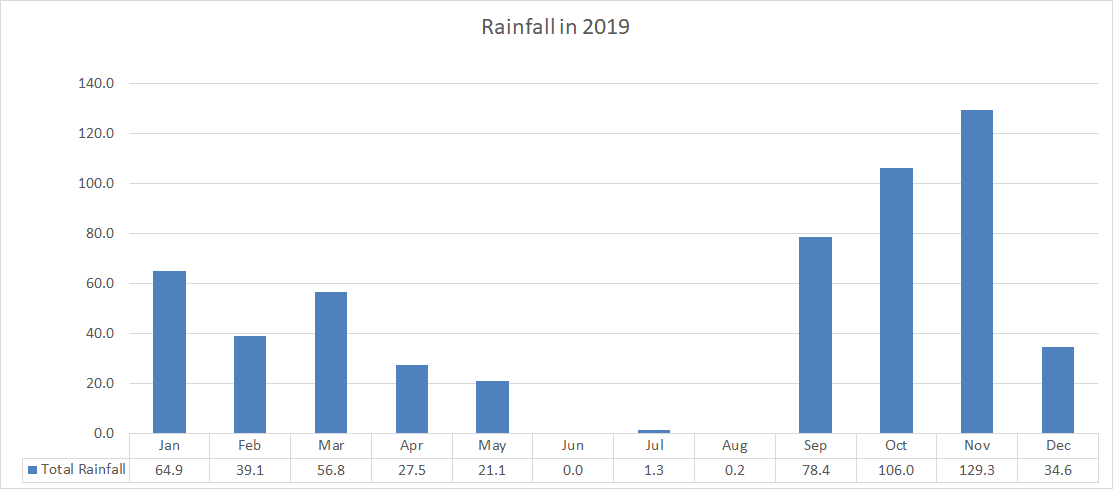
Precipitation
| Total Rainfall During 2018 | 559.2 mm |
| Highest 24 Hour Total | 47.8 mm | 11th November 2019 |
| Rain Days | 92 days |
| Thunderstorm Days | 31 days |
| Hail Days | 20 days |
Rainfall Events
| 03/01/2019 | 1.3 mm | Light Rain/Hail |
| 06/01/2019 | 2.5 mm | Light Rain/Hail |
| 09/01/2019 | 12.1 mm | Showers |
| 10/01/2019 | 1.0 mm | Light Rain |
| 11/01/2019 | 2.0 mm | Light Rain |
| 12/01/2019 | 0.3 mm | Drizzle |
| 13/01/2019 | 2.0 mm | Showers |
| 14/01/2019 | 7.9 mm | Showers |
| 17/01/2019 | 2.4 mm | Showers |
| 19/01/2019 | 3.6 mm | Showers |
| 20/01/2019 | 6.6 mm | Thundery Rain/Hail Showers |
| 22/01/2019 | 2.8 mm | Showers |
| 23/01/2019 | 0.8 mm | Light Rain |
| 24/01/2019 | 8.4 mm | Rain/Hail Showers |
| 25/01/2019 | 6.4 mm | Rain/Hail Showers |
| 26/01/2019 | 1.7 mm | Shower |
| 27/01/2019 | 0.3 mm | Drizzle |
| 29/01/2019 | 2.3 mm | Thundery Rain/Hail Showers |
| 30/01/2019 | 0.5 mm | Drizzle |
| 03/02/2019 | 3.2 mm | Thundery Rain/Hail Showers |
| 04/02/2019 | 10.2 mm | Showers; Steady Rain |
| 05/02/2019 | 11.6 mm | Thundery Rain/Hail Showers; Steady Rain |
| 07/02/2019 | 0.6 mm | Shower |
| 09/02/2019 | 0.9 mm | Shower |
| 16/02/2019 | 0.8 mm | Shower |
| 23/02/2019 | 6.9 mm | Rain/Hail Showers |
| 24/02/2019 | 2.8 mm | Rain/Hail Showers |
| 28/02/2019 | 3.0 mm | Shower |
| 02/03/2019 | 0.5 mm | Isolated Shower |
| 06/03/2019 | 0.5 mm | Heavy Dewfall |
| 10/03/2019 | 0.3 mm | Heavy Dewfall |
| 12/03/2019 | 0.3 mm | Light Rain Shower |
| 15/03/2019 | 2.0 mm | Light Rain |
| 18/03/2019 | 0.3 mm | Heavy Dewfall |
| 21/03/2019 | 27.4 mm | Thunderstorm |
| 22/03/2019 | 2.5 mm | Light Rain |
| 24/03/2019 | 0.3 mm | Heavy Dewfall |
| 27/03/2019 | 22.7 mm | Thunderstorm |
| 04/04/2019 | 1.8 mm | Light Rain |
| 05/04/2019 | 19.1 mm | Thunderstorm |
| 07/04/2019 | 4.3 mm | Isolated Showers |
| 14/04/2019 | 2.0 mm | Isolated Showers |
| 22/04/2019 | 0.3 mm | Light Thunderstorm |
| 03/05/2019 | 7.8 mm | Showers |
| 04/05/2019 | 0.5 mm | Light Thunderstorm |
| 12/05/2019 | 2.5 mm | Light Thunderstorm |
| 13/05/2019 | 0.3 mm | Drizzle |
| 14/05/2019 | 2.3 mm | Light Rain |
| 16/05/2019 | 5.6 mm | Thunderstorm |
| 26/05/2019 | 1.8 mm | Light Thunderstorm |
| 30/05/2019 | 0.3 mm | Light Rain |
| 16/07/2019 | 1.3 mm | Shower |
| 29/08/2019 | 0.2 mm | Light Rain |
| 01/09/2019 | 1.0 mm | Light Rain |
| 02/09/2019 | 17.9 mm | Thunderstorm |
| 04/09/2019 | 6.7 mm | Thunderstorm |
| 05/09/2019 | 0.5 mm | Light Rain; Distant Thunder |
| 09/09/2019 | 1.5 mm | Isolated Shower |
| 10/09/2019 | 44.7 mm | Thunderstorm with Hail |
| 11/09/2019 | 5.4 mm | Isolated Showers |
| 22/09/2019 | 0.7 mm | Light Rain |
| 07/10/2019 | 24.1 mm | Thunderstorm; Steady Light Rain |
| 08/10/2019 | 1.4 mm | Isolated Shower |
| 09/10/2019 | 15.0 mm | Thunderstorms |
| 10/10/2019 | 0.3 mm | Isolated Shower |
| 16/10/2019 | 4.8 mm | Thunderstorm |
| 25/10/2019 | 13.9 mm | Thunderstorm |
| 27/10/2019 | 6.4 mm | Thunderstorm |
| 28/10/2019 | 24.6 mm | Thunderstorm |
| 29/10/2019 | 10.0 mm | Thunderstorm |
| 30/10/2019 | 4.5 mm | Thunderstorm |
| 31/10/2019 | 1.0 mm | Isolated Shower |
| 01/11/2019 | 11.4 mm | Thunderstorm |
| 06/11/2019 | 3.6 mm | Steady Light Rain |
| 07/11/2019 | 5.4 mm | Steady Light Rain |
| 08/11/2019 | TR mm | Drizzle schweiz-libido.com |
| 09/11/2019 | 5.5 mm | Isolated Showers |
| 10/11/2019 | 0.8 mm | Drizzle |
| 11/11/2019 | 47.8 mm | Thunderstorms |
| 12/11/2019 | 24.7 mm | Rainy |
| 13/11/2019 | 1.8 mm | Light Rain |
| 17/11/2019 | 0.1 mm | Drizzle |
| 19/11/2019 | 1.5 mm | Light Rain |
| 24/11/2019 | 12.4 mm | Thunderstorms |
| 25/11/2019 | 14.0 mm | Thunderstorms |
| 26/11/2019 | 0.3 mm | Drizzle |
| 09/12/2019 | 0.2 mm | Drizzle |
| 10/12/2019 | 9.2 mm | Rain/Hail Showers |
| 11/12/2019 | 0.3 mm | Drizzle |
| 12/12/2019 | 11.0 mm | Intermittent Rain/Hail |
| 13/12/2019 | 3.5 mm | Isolated Showers |
| 14/12/2019 | 0.8 mm | Drizzle |
| 22/12/2019 | 1.0 mm | Drizzle |
| 23/12/2019 | 0.3 mm | Drizzle |
| 30/12/2019 | 2.8 mm | Rain/Hail Showers |
| 31/12/2019 | 5.5 mm | Rain/Hail Showers |
2019 Compared to the Climate Means
| Climate Mean | 2019 | Anomaly | |
| Mean Maximum Temperature | 20.8°C | 22.6°C | +1.8°C |
| Mean Minimum Temperature | 15.6°C | 16.4°C | +0.8°C |
| Mean Temperature | 18.2°C | 19.5°C | +1.3°C |
| Mean Relative Humidity | 76% | 63.8% | -12.2% |
| Mean Atmospheric Pressure | 1016.5hPa | 1016.2hPa | -0.3hPa |
| Mean Wind Speed | 16.4 km/h | 16.2 km/h | -0.2 km/h |
| Most Frequent Wind Direction | West Northwest | West Southwest | -45° |
| Total Rainfall | 585.6 mm | 559.2 mm | -26.4 mm |
| Total Rain Days | 84 days | 92 days | +8 days |
| Total Thunderstorm Days | 26 days | 31 days | +5 day |
| Total Hail Days | 8 days | 20 days | +12 days |
Month-by-Month Summary for 2019
January 2019 – Colder and Drier
February 2019 – Average Temperatures and Drier
March 2019 – Warmer and Wetter
April 2019 – Colder and Wetter
May 2019 – Colder and Wetter
June 2019 – Warmer and Drier
July 2019 – Warmer with Average Rainfall
August 2019 – Warmer and Drier
September 2019 – Warmer and Wetter
October 2019 – Warmer and Wetter
November 2019 – Warmer and Wetter
December 2019 – Warmer and Drier
2019: The Warmest Year this Decade
2019 was the warmest year in the last decade. With a mean temperature of 19.5˚C, the annual average was exceeded by 1.3˚C. The greatest difference from the climate mean was recorded in maximum temperatures. All spring months, along with January, were colder than average. Conversely, all months from June onward were warmer than average. June 2019 was record breaking. It was the hottest June to ever be experienced in the Maltese Islands. It broke the record set in June 2003. The hottest day in 2019 was to be 9th July, when the mercury soared to 38.3˚C at the height of a heatwave. The coldest night in 2019 was to be 23rd February, when the thermometer dipped to 3.9˚C ahead of the strongest wind storm since 1982.
Total rainfall over the course of 2019 was close to average. A total of 559.2 mm was measured last year. The wettest month last year was November, followed closely by October. The two months accounted for almost half of the total annual rainfall. Both spring and autumn were notably wetter than average. As usual, summer was extremely dry. The number of days with rain, thunder and hail were all greater than normal. The highest 24-hour total was of 47.8 mm on 11th November. This broke no records, and was in fact, much lower than what one would normally expect in a typical year. There were no severe rainfall events in 2019.
Averaging at 16.2 km/h, the wind speed conformed with the value of a typical year. February set new records with regards to wind, however. February is typically a windy month. This year, it was certainly no different. The highest gust last month was registered at 101km/h from the Southeast. This was the strongest ever recorded at our weather station in Għarb. It was during the worst Gregalata since 1982.
Overall, the average atmospheric pressure was also very close to the norm. The highest value of atmospheric pressure was recorded on the 15th, 17th and 18th of February. It reached 1030 hPa on all three days. The lowest value of atmospheric pressure, on the other hand, was taken on 25th January. It dropped to 987hPa for some moments.
2019’s highlight was without a doubt the record-breaking Gregale on 23rd and 24th February. The system that produced the severe gale was a Mediterranean cyclone. The Mediterranean cyclone that formed late on Saturday 23/02 and lasted till late on Sunday 24/02, was the very first since the one in November 2014. A strong jet-stream blew some very warm and humid air masses from the Ionian Sea, the Gulf of Gabes and the Gulf of Sirte towards the central Mediterranean. Simulateneously, frigid air from over the Balkans penetrated the central Mediterranean, initiating the process of Mediterranean Cyclone development. This was the strongest wind since the year 1982. A gust of 101km/h (Force 10) broke the long-standing wind gust record at our weather station in Għarb. The storm-force winds left behind a trail of destruction.
0 comments
Write a comment