End of Month Reports

End of Month Reports

Cooler Days but Warmer Nights in July 2025

Air Temperature

Highest Maximum 37.7°C 25th
Lowest Maximum 27.1°C 27th
Highest Minimum 26.1°C 8th
Lowest Minimum 21.2°C 12th


Mean Maximum 30.9°C
Mean Minimum 23.6°C
Mean 27.3°C


Relative Humidity

Highest Relative Humidity 96% Numerous days
Lowest Relative Humidity 18% 24th


Mean Relative Humidity 77.4%


Wind

Highest Gust 48.3km/h 27th


Mean Wind Speed 10.7km/h
Most Frequent Wind Direction Northwest


Atmospheric Pressure

Highest Atmospheric Pressure 1020.2hPa 13th
Lowest Atmospheric Pressure 1010.1hPa 28th


Mean Atmospheric Pressure 1014.1hPa


Precipitation

Total Rainfall During July 2025 0.0 mm
Total Rainfall Since Last 01/09 503.4 mm


Highest 24 Hour Total / /


Rain Days 0 days
Thunderstorm Days 0 days
Hail Days 0 days


July 2025 Compared to the Climate Means

  Climate Mean July 2025 Anomaly
Mean Maximum Temperature 31.6°C 30.9°C  -0.7°C
Mean Minimum Temperature 22.5°C 23.6°C +1.1°C
Mean Temperature 27.0°C 27.3°C +0.3°C
Mean Relative Humidity 70.2% 77.4% +7.2%
Mean Atmospheric Pressure 1014.6hPa 1014.1hPa -0.5hPa
Total Rainfall 0.2 mm 0.0 mm -0.2 mm
Total Rainfall Since Last 01/09 514.7 mm 503.4 mm -11.3 mm
Total Rain Days 0 days 0 days /
Total Thunderstorm Days 0 days 0 days /
Total Hail Days 0 days 0 days /


Cooler Days but Warmer Nights in July 2025

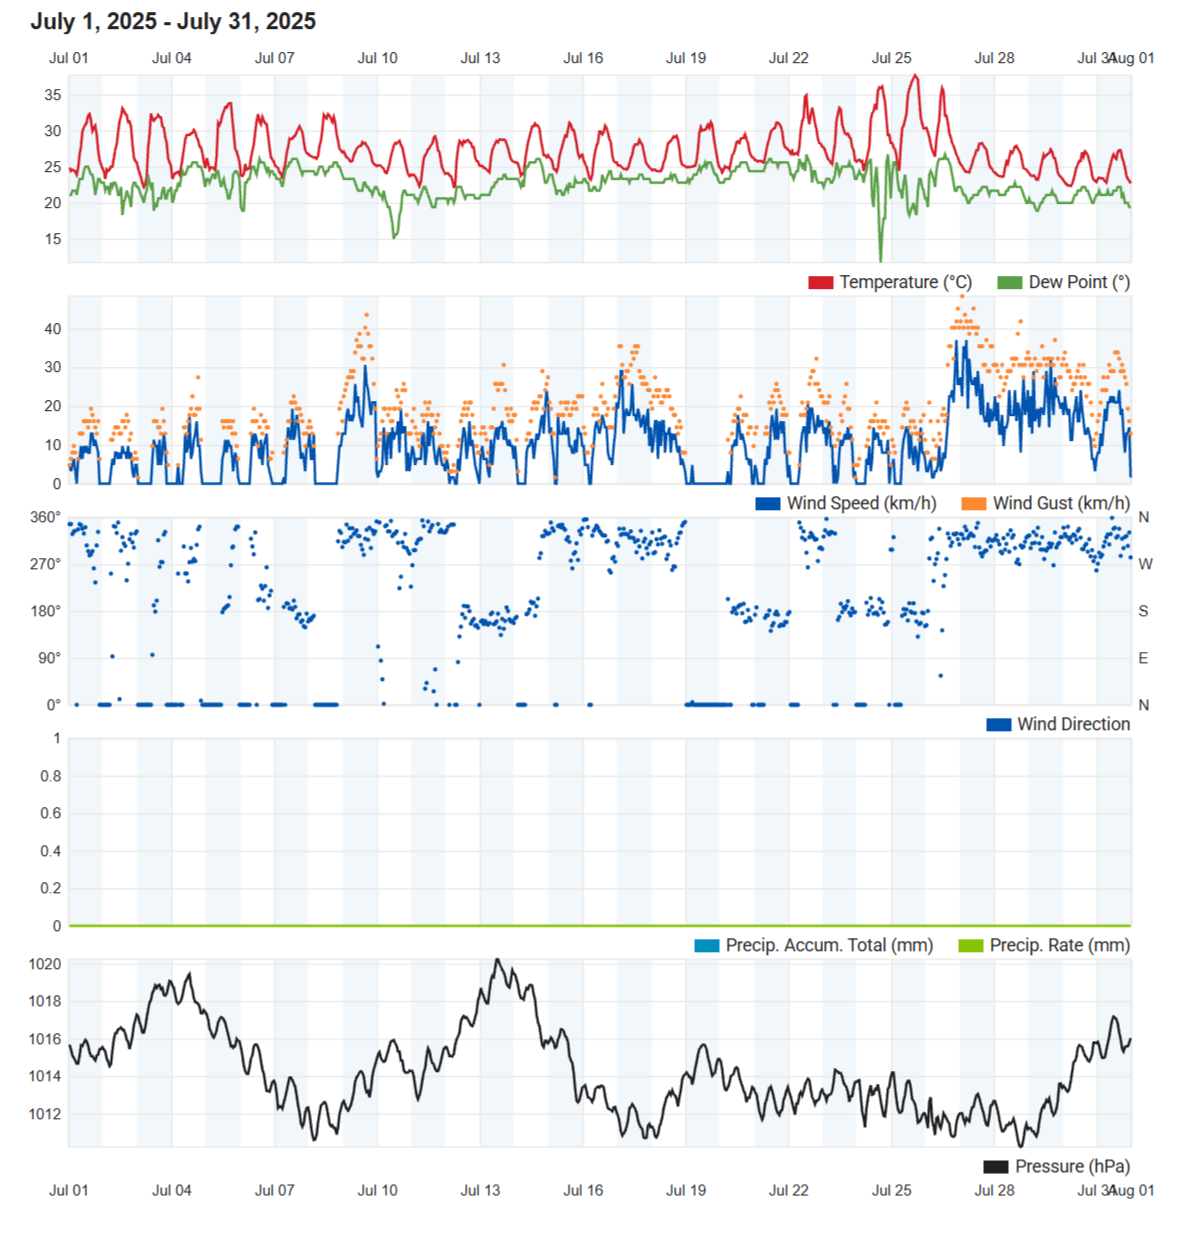
Other than two heat spells; one towards the beginning and another towards the end, July was relatively merciful. The mean temperature last month was only 0.3°C above the climate norm of 27.0°C. Whilst the mean maximum temperature of 30.9°C was  0.7°C cooler than the norm, July’s mean minimum temperature of 23.6°C was 1.1°C warmer than average. This could be due to an elevated relative humidity. Levels of humidity averaged at 77.4%, a significant 7.2% over the climate norm. Elevated humidity prevents temperatures from shooting up during the day, but keeps them from cooling down at night. Despite the cooler maximum temperatures overall, real feels were generally uncomfortable, once again owing to the humidity levels. The main contributor to the greater humidity was the very warm sea. A downpour across parts of the Maltese Islands on the eve of summer solstice was also a contributing factor. Outbreaks of days with a breezy Northwesterly wind also ensured that temperatures didn’t get too hot for too long. The hottest day last month was the 25th, with the thermometers marking 37.7°C. Overall, values were typical of what one would expect from a Maltese summer.

July 2024 also lived up to its expectation of being a completely dry month. No rain made it to the Maltese Islands throughout. Some mist or fog patches were observed.

Rainfall Totals around the Maltese Islands in July 2025 (and since last September 1st):

Kerċem: 0.0 mm (503.4 mm)

Victoria: 0.0 mm (520.3 mm)

Marsalforn: 0.0 mm (433.2 mm)

Xewkija: 0.0 mm (371.3 mm)

Nadur: 0.0 mm (484.3 mm)

Għajnsielem: 0.0 mm (421.0 mm)

Mellieħa: 0.0 mm (375.8 mm)

Buġibba: 0.0 mm (369.9 mm)

Mġarr: 0.0 mm (450.0 mm)

Naxxar: 0.0 mm (466.6 mm)

Mosta: 0.0 mm (460.2 mm)

Dingli: 0.0 mm (569.3 mm)

Pembroke: 0.0 mm (491.8 mm)

Msida: 0.0 mm (547.8 mm)

Sliema: 0.0 mm (449.6 mm)

Valletta: 0.0 mm (457.8 mm)

Fgura: 0.0 mm (547.4 mm)

Żejtun: 0.0 mm (499.2 mm)

Żabbar: 0.0 mm (552.2 mm)

Imqabba: 0.0 mm (529.1 mm)

Siġġiewi: 0.0 mm (485.7 mm)

Żurrieq: 0.0 mm (473.4 mm)

Marsaxlokk: 0.0 mm (383.8 mm)

NATIONAL MEAN: 0.0 mm (469.2 mm)

End of Month Reports

Warmer than Average in June 2025

Air Temperature

Highest Maximum 32.8°C 29th
Lowest Maximum 24.3°C 2nd
Highest Minimum 24.9°C 27th
Lowest Minimum 14.6°C 1st


Mean Maximum 30.1°C
Mean Minimum 20.8°C
Mean 25.4°C


Relative Humidity

Highest Relative Humidity 95% 20th
Lowest Relative Humidity 19% 6th


Mean Relative Humidity 71.9%


Wind

Highest Gust 37.0km/h 4th


Mean Wind Speed 5.8km/h
Most Frequent Wind Direction West Northwest


Atmospheric Pressure

Highest Atmospheric Pressure 1023.4hPa 2nd
Lowest Atmospheric Pressure 1014.4hPa 11th


Mean Atmospheric Pressure 1017.8hPa


Precipitation

Total Rainfall During June 2025 22.5 mm
Total Rainfall Since Last 01/09 503.4 mm


Highest 24 Hour Total 22.5 mm 20th


Rain Days 1 day
Thunderstorm Days 0 days
Hail Days 0 days


Rainfall Events

20/6/2025 22.5 mm P.M. Downpours


June 2025 Compared to the Climate Means

  Climate Mean June 2025 Anomaly
Mean Maximum Temperature 28.5°C 30.1°C  +1.6°C
Mean Minimum Temperature 19.8°C 20.8°C +1.0°C
Mean Temperature 24.2°C 25.4°C +1.2°C
Mean Relative Humidity 70.5% 71.9% +1.4%
Mean Atmospheric Pressure 1015.1hPa 1017.8hPa +2.7hPa
Total Rainfall 4.1 mm 22.5 mm +18.4 mm
Total Rainfall Since Last 01/09 518.6 mm 503.4 mm -15.2 mm
Total Rain Days 1 day 1 day /
Total Thunderstorm Days 1 day 0 days -1 day
Total Hail Days 0 days 0 days /


Warmer than Average in June 2025

 June was off to a comfortable start. This lasted only briefly, however, as the heat of summer quickly turned up on the 7th. From then on, temperatures were above the climatic norm of 24.2°C on 23 days out of 24. The single cooler day was the 20th, a day which brought a series of afternoon downpours to parts of the Maltese Islands, the heaviest of which struck Gozo. The 29th, a Sunday, was the warmest day last month. The temperature peaked at 32.8°C on the day. For comparison, the mean maximum temperature for June is of 28.5°C. The pre-dawn hours of the 1st day of the month were the coolest, with a minimum temperature of 14.6°C. June’s climatic mean minimum temperature of 19.8°C was exceeded by a total of 21 out of 30 nights.

Large swathes of western Europe were affected by a particularly intense heat wave, with temperature values regularly in the upper 40°Cs across Spain and Portugal. In addition to this, the entire Mediterranean basin experienced an incredible lack of wind, widespread calm sea and uninterrupted blazing sunshine for much of June. This means that transfer of heat from the Sun to the sea surface is uninterrupted. The lack of wind and waves means that the sea isn’t mixing. This leads to a build-up of heat in the topmost layer of the sea. When the sea warms up too much, marine ecosystems are negatively impacted. Several marine species are not adapted to the warmer waters and therefore will suffer from poor health if not die. The lifecycle of numerous marine species goes haywire, especially where reproduction is concerned. Furthermore, marine ecosystems (especially those in shallower waters) experience a degree of degradation. The rates of oxygen dissolved in the water will also vary more widely. Finally, some alien species find it easier to spread in warmer waters, threatening the existence of more indigenous marine life. A very high sea surface temperature inhibits nighttime cooling in air temperatures. The high sea surface temperature will also contribute to increased rates of evaporation, which in turn, will lead to increased humidity. The more humid the air is, the warmer and clammier it will feel. Early and late mist or fog patches are also products of these increased levels of humidity.

June brought with it one day of rain. Rainfall was in the form of localized downpours, over the central and northern coasts of both Malta and Gozo. Surprisingly, Gozo received the heaviest rainfall. Being the larger island, it is Malta that normally receives the most rainfall from these downpours. These clouds develop thanks to the vertical movement of columns of warm and humid air on sunny days and when the upper levels of the atmosphere are unstable due to the incursion of cold air from northern Europe. This is a process caused when the cold air in the upper levels of the atmosphere contrasts with the ground that has been well heated by the sun locally. This movement encourages the condensation of water vapor in this air and thus the formation of clouds. These showers, which affected only localized areas, lasted for a long while. Victoria, in Gozo, recorded up to 26.9 mm on that day. The national mean for the day, and also the month, was of 3.2 mm.

Rainfall Totals around the Maltese Islands in June 2025 (and since last September 1st):

Kerċem: 22.5 mm (503.4 mm)

Victoria: 26.9 mm (520.3 mm)

Marsalforn: 1.4 mm (433.2 mm)

Xewkija: 8.8 mm (371.3 mm)

Nadur: 1.2 mm (484.3 mm)

Għajnsielem: 0.0 mm (421.0 mm)

Mellieħa: 0.0 mm (375.8 mm)

Buġibba: 0.0 mm (369.9 mm)

Mġarr: 0.0 mm (450.0 mm)

Naxxar: 6.6 mm (466.6 mm)

Mosta: 0.8 mm (460.2 mm)

Dingli: 0.0 mm (569.3 mm)

Pembroke: 6.2 mm (491.8 mm)

Msida: 1.5 mm (547.8 mm)

Sliema: 1.2 mm (449.6 mm)

Valletta: 0.0 mm (457.8 mm)

Fgura: 0.0 mm (547.4 mm)

Żejtun: 0.0 mm (499.2 mm)

Żabbar: 0.0 mm (552.2 mm)

Imqabba: 0.0 mm (529.1 mm)

Siġġiewi: 0.0 mm (485.7 mm)

Żurrieq: 0.0 mm (473.4 mm)

Marsaxlokk: 0.0 mm (383.8 mm)

NATIONAL MEAN: 3.2 mm (469.2 mm)


End of Month Reports

Warmer but Wetter than Average in May 2025

Air Temperature

Highest Maximum 28.6°C 20th
Lowest Maximum 21.3°C 16th
Highest Minimum 20.2°C 20th
Lowest Minimum 12.2°C 3rd

Mean Maximum 24.1°C
Mean Minimum 17.0°C
Mean 20.5°C

Relative Humidity

Highest Relative Humidity 97% Numerous days
Lowest Relative Humidity 29% 3rd

Mean Relative Humidity 79.0%

Wind

Highest Gust 51.5km/h 15th

Mean Wind Speed 11.8km/h
Most Frequent Wind Direction Northwest

Atmospheric Pressure

Highest Atmospheric Pressure 1022.7hPa 18th
Lowest Atmospheric Pressure 1002.5hPa 15th

Mean Atmospheric Pressure 1015.2hPa

Precipitation

Total Rainfall During May 2025 35.3 mm
Total Rainfall Since Last 01/09 480.9 mm

Highest 24 Hour Total 29.0 mm 15th

Rain Days 5 days
Thunderstorm Days 3 days
Hail Days 0 days

Rainfall Events

6/5/2025 1.4 mm A.M. Thunderstorms
9/5/2025 2.8 mm Thunderstorm
15/5/2025 29.0 mm Showers; Distant Thunder; P.M. Thunderstorm
16/5/2025 0.3 mm A.M. Isolated Shower
25/5/2025 1.8 mm A.M. Isolated Showers

May 2025 Compared to the Climate Means

  Climate Mean May 2025 Anomaly
Mean Maximum Temperature 23.9°C 24.1°C  +0.2°C  
Mean Minimum Temperature 15.9°C 17.0°C +1.1°C 
Mean Temperature 19.9°C 20.5°C +0.6°C 
Mean Relative Humidity 74.5% 79.0% +4.5% 
Mean Atmospheric Pressure 1015.9hPa 1015.2hPa -0.7hPa 
Total Rainfall 9.8 mm 35.3 mm +25.5 mm
Total Rainfall Since Last 01/09 514.5 mm 480.9 mm -33.6 mm
Total Rain Days 4 days 5 days +1 day
Total Thunderstorm Days 1 day 3 days +2 days
Total Hail Days 0 days 0 days /

Warmer but Wetter than Average in May 2025

May was a mixed bag of spring weather. As spring settled in across the Maltese Islands, May was characterized by a mix of pleasant weather and occasional instability, including a day of intense thundery downpours. Despite the occasional unsettled spell, last month was warmer than average.

35.3 mm of rain was recorded at our weather station in May. The national mean was around this value too. This was almost four times the climate norm. There were five days with rain over the course of the month. One of them accounted for the vast majority of this rainfall: a staggering 29 mm of it. This was from a series of thundery downpours which affected all of the Maltese Islands on the 15th. The 15th also accounted for the month’s highest wind gust. That day was characterized by a near gale from the South Southeast. The remaining rainy days brought elevated thunderstorms with lots of loud thunder but modest rainfall accumulations. Copious amounts of fine desert sand were deposited by the lighter thunderstorms.

May’s mean temperature of 20.528 was just over half a degree warmer than the climate norm. While daytime temperatures were only marginally warmer than average, nights were warmer by just over a degree. The warmest day and night were those of the 28th with a maximum and minimum of  28.6°C and 20.2°C respectively. The coldest night came earlier in the month, on the 3rd April, with a minimum temperature of 12.2°C on a calm and clear night.

Levels of relative humidity were also noticeably elevated at 79.0%; owing to the wetter than average conditions.

Rainfall Totals around the Maltese Islands in May 2025 (and since last September 1st): 

Kerċem: 35.3 mm (480.9 mm)

Victoria: 24.4 mm (493.4 mm)

Marsalforn: 29.1 mm (431.8 mm)

Xewkija: 31.3 mm (362.5 mm)

Nadur: 32.3 mm (483.1 mm)

Għajnsielem: 25.9 mm (421.0 mm)

Mellieħa: 35.2 mm (375.8 mm)

Buġibba: 36.6 mm (369.9 mm)

Mġarr: 33.9 mm (450.0 mm)

Naxxar: 32.3 mm (460.0 mm)

Mosta: 35.4 mm (459.4 mm)

Dingli: 36.1 mm (569.3 mm)

Pembroke: 38.9 mm (485.4 mm)

Msida: 36.9 mm (546.3 mm)

Sliema: 36.1 mm (448.4 mm)

Valletta: 32.8 mm (457.8 mm)

Fgura: 45.0 mm (547.4 mm)

Żejtun: 38.8 mm (499.2 mm)

Żabbar: 37.1 mm (552.2 mm)

Imqabba: 40.9 mm (529.1 mm)

Siġġiewi: 41.9 mm (485.7 mm)

Żurrieq: 29.3 mm (473.4 mm)

Marsaxlokk: 28.8 mm (383.8 mm)

NATIONAL MEAN: 34.2 mm (466.0 mm)

End of Month Reports

April 2025 Ends on a Thundery Note

Air Temperature

Highest Maximum 25.9°C 16th
Lowest Maximum 16.3°C 1st
Highest Minimum 17.3°C 15th
Lowest Minimum 8.3°C 3rd


Mean Maximum 20.2°C
Mean Minimum 12.9°C
Mean 16.5°C


Relative Humidity

Highest Relative Humidity 96% Numerous days
Lowest Relative Humidity 40% 20th


Mean Relative Humidity 79.9%


Wind

Highest Gust 46.7km/h 15th and 16th


Mean Wind Speed 10.1km/h
Most Frequent Wind Direction Northwest


Atmospheric Pressure

Highest Atmospheric Pressure 1023.3hPa 9th
Lowest Atmospheric Pressure 1000.9hPa 1st


Mean Atmospheric Pressure 1015.5hPa


Precipitation

Total Rainfall During April 2025 32.3 mm
Total Rainfall Since Last 01/09 445.6 mm


Highest 24 Hour Total 31.1 mm 29th


Rain Days 3 days
Thunderstorm Days 2 days
Hail Days 1 day


Rainfall Events

1/5/2025 0.9 mm Isolated Shower; Distant Thunderstorms
7/5/2025 0.3 mm A.M. Isolated Light Rain
29/5/2025 31.1 mm A.M. Thunderstorms with Hail


April 2025 Compared to the Climate Means

  Climate Mean April 2025 Anomaly
Mean Maximum Temperature 19.8°C 20.2°C  +0.4°C
Mean Minimum Temperature 13.0°C 12.9°C -0.1°C
Mean Temperature 16.4°C 16.5°C +0.1°C
Mean Relative Humidity 77.1% 79.9% +2.8%
Mean Atmospheric Pressure 1016.3hPa 1015.5hPa -0.8hPa
Total Rainfall 17.0 mm 32.3 mm +15.3 mm
Total Rainfall Since Last 01/09 504.7 mm 445.6 mm -59.1 mm
Total Rain Days 6 days 3 days -3 days
Total Thunderstorm Days 1 day 2 days +1 day
Total Hail Days 0 days 1 day +1 day


April 2025 Ends on a Thundery Note


With a mean temperature of 16.5°C, temperatures in April were on par with the climate norm. Temperatures warmed up gradually as the month progressed, in typical springtime fashion.

With a national mean of 13.2 mm, rainfall was overall below the norm. In this case, simply looking at the national mean is extremely misleading. Whilst all localities in Malta featured rainfall values below the climate norm of 17.0 mm, all localities on the sister island of Gozo presented with rainfall totals well-above that. In fact, some localities registered double this! Having featured only a handful of showers over two separate days, April 2025 was relatively dry until the final few days. A zone of instability coupled with cold air aloft and an absence of wind at all levels of the atmosphere allowed for the formation of an area of thunderstorms around the central Mediterranean. Gozo was affected by a series of three thunderstorms in the hours between midnight and dawn on the 29th. The extreme west, southwest and south coasts of Malta were struck by one in the morning. This made for some very loud and frequent thunder which is more often synonymous with the autumn months. Hail was also observed in some localities. This meteorological event was probably the only one thing that stood out from an otherwise normal month.

Values for relative humidity, atmospheric pressure and wind showed marginal deviation from the climate norm; further confirming a typical April overall.

Rainfall Totals around the Maltese Islands in April 2025 (and since last September 1st):

Kerċem: 32.3 mm (445.6 mm)

Victoria: 39.2 mm (469.0 mm)

Marsalforn: 34.5 mm (402.7 mm)

Xewkija: 29.3 mm (331.2 mm)

Nadur: 32.8 mm (450.8 mm)

Għajnsielem: 28.0 mm (395.1 mm)

Mellieħa: 8.2 mm (340.6 mm)

Buġibba: 3.1 mm (333.3 mm)

Mġarr: 4.6 mm (416.1 mm)

Naxxar: 2.3 mm (427.7 mm)

Mosta: 0.3 mm (424.0 mm)

Dingli: 0.6 mm (533.2 mm)

Pembroke: 9.2 mm (446.5 mm)

Msida: 6.6 mm (509.4 mm)

Sliema: 11.9 mm (412.3 mm)

Valletta: 9.2 mm (425.0 mm)

Fgura: 4.8 mm (502.4 mm)

Żejtun: 5.6 mm (460.4 mm)

Żabbar: 8.0 mm (515.1 mm)

Imqabba: 14.0 mm (488.2 mm)

Siġġiewi: 2.3 mm (443.8 mm)

Żurrieq: 9.5 mm (444.1 mm)

Marsaxlokk: 2.8 mm (355.0 mm)

NATIONAL MEAN: 13.2 mm (431.7 mm)


End of Month Reports

Warmer but Wetter in March 2025

Air Temperature

Highest Maximum 26.8°C 23rd
Lowest Maximum 14.7°C 7th
Highest Minimum 16.8°C 23rd
Lowest Minimum 8.6°C 21st


Mean Maximum 18.8°C
Mean Minimum 12.7°C
Mean 15.8°C


Relative Humidity

Highest Relative Humidity 97% Numerous days
Lowest Relative Humidity 40% 23rd


Mean Relative Humidity 81.4%


Wind

Highest Gust 59.5km/h 23rd


Mean Wind Speed 12.5km/h
Most Frequent Wind Direction Southeast


Atmospheric Pressure

Highest Atmospheric Pressure 1032.2hPa 20th
Lowest Atmospheric Pressure 1002.1hPa 12th


Mean Atmospheric Pressure 1014.9hPa


Precipitation

Total Rainfall During March 2025 78.0 mm
Total Rainfall Since Last 01/09 413.3 mm


Highest 24 Hour Total 33.2 mm 7th


Rain Days 12 days
Thunderstorm Days 4 days
Hail Days 0 days


Rainfall Events

4/3/2025 6.4 mm A.M. Shower
5/3/2025 0.2 mm Isolated Light Rain
6/3/2025 0.5 mm Isolated Light Rain
7/3/2025 33.2 mm Continuous Rain
8/3/2025 0.0 mm Distant Isolated Light Rain
23/3/2025 0.5 mm Isolated Light Rain with Dust
24/3/2025 TR mm Distant Isolated Light Rain with Dust
25/3/2025 8.5 mm A.M. Isolated Thunderstorm; Showers
26/3/2025 21.7 mm A.M. Steady Rain; Distant Thunder
27/3/2025 0.8 mm Isolated Thundery Showers
28/3/2025 1.6 mm Isolated Thundery Showers
29/3/2025 2.0 mm Isolated Showers
30/3/2025 2.6 mm Isolated Showers


March 2025 Compared to the Climate Means

  Climate Mean March 2025 Anomaly
Mean Maximum Temperature 17.1°C 18.9°C  +1.8°C
Mean Minimum Temperature 10.9°C 12.7°C +1.8°C
Mean Temperature 14.0°C 15.8°C +1.8°C
Mean Relative Humidity 78.1% 81.4% +3.3%
Mean Atmospheric Pressure 1017.3hPa 1014.9hPa -2.4hPa
Total Rainfall 40.3 mm 78.0 mm +37.7 mm
Total Rainfall Since Last 01/09 487.7 mm 413.3 mm -74.4 mm
Total Rain Days 9 days 12 days +3 days
Total Thunderstorm Days 2 days 4 days +2 days
Total Hail Days 1 day 0 days -1 day


Warmer but Wetter in March 2025

A staggering 18 days were dominated by winds from the Southeasterly quadrant. Winds from these directions, referred to collectively as Scirocco are common in the springtime, but their dominance this March was greater than normal. In the transitional month of spring, a series of low pressure systems originate over northern Africa. Sciroccos occur in advance of a low pressure system moving eastward across the southern Mediterranean Sea or northern Africa. Air from high pressure over the Sahara Desert rushes in to fill this low pressure system. The rushing air manifests itself as a Scirocco. Their prevalence impacted the local weather in a number of ways.

At 15.8°C, mean temperatures were 1.8°C warmer than the norm. The difference from the mean for both maximum and minimum temperatures stood at the same value. The month’s warmest temperature was measured in the evening of the 23rd. Measured at 26.8°C, this was during one of several heat bursts. Starting soon after 18:30, the air temperature rose rapidly from around 16.9°C to 26.8°C in a space of just a few minutes. Levels of relative humidity also experienced a sharp drop, from a humid 92% to an extremely dry 40%, all in a gap of a few minutes. In typical heat burst fashion, the wind increased dramatically from a lull to gale-force in a matter of minutes. The behaviour of air pressure also revealed tell-tale signs of a heat burst. It climbed by 3hPa, from 1009.5hPa to 1012.5hPa, over the same time. This lasted for some time and occurred several times. That evening also accounted for the month’s highest wind gust of 59.5km/h.

Relative humidity stood at an uncomfortable level of 81.4% overall. Numerous days recorded means of above 90%.

March 2025 was the third month with more rainfall than average since September 1st and the second consecutive after February 2025. A total of 78.0 mm were measured at our weather station in Gozo. Spread over 12 days, this rainfall continued the recovery from a dry start to the rainfall year. The plentiful rainfall was the result of successive low-pressure systems from over north Africa. The bulk came from two of these; one during the first week of the month and another towards its end.

Rainfall Totals around the Maltese Islands in March 2025 (and since last September 1st):

Kerċem: 78.0 mm (413.3 mm)

Victoria: 90.8 mm (429.8 mm)

Marsalforn: 81.4 mm (368.2 mm)

Xewkija: 69.8 mm (301.9 mm)

Nadur: 91.8 mm (418.0 mm)

Għajnsielem: 85.1 mm (367.1 mm)

Mellieħa: 74.3 mm (332.4 mm)

Buġibba: 70.2 mm (330.2 mm)

Mġarr: 80.4 mm (411.5 mm)

Naxxar: 74.1 mm (425.4 mm)

Mosta: 80.0 mm (423.7 mm)

Dingli: 100.7 mm (532.6 mm)

Pembroke: 88.1 mm (437.3 mm)

Msida: 77.5 mm (502.8 mm)

Sliema: 72.2 mm (400.4 mm)

Valletta: 64.7 mm (415.8 mm)

Fgura: 84.8 mm (497.6 mm)

Żejtun: 90.9 mm (454.8 mm)

Żabbar: 80.8 mm (507.1 mm)

Imqabba: 89.9 mm (474.2 mm)

Siġġiewi: 82.3 mm (441.5 mm)

Żurrieq: 88.1 mm (434.6 mm)

Marsaxlokk: 66.3 mm (352.2 mm)

NATIONAL MEAN: 80.4 mm (418.5 mm)

End of Month Reports

February 2025 – Rainfall Totals Bounce Back

Air Temperature

Highest Maximum 19.6°C 13th
Lowest Maximum 14.9°C 10th
Highest Minimum 13.2°C 1st
Lowest Minimum 5.8°C 23rd


Mean Maximum 17.1°C
Mean Minimum 10.0°C
Mean 13.5°C


Relative Humidity

Highest Relative Humidity 95% Numerous days
Lowest Relative Humidity 58% 22nd


Mean Relative Humidity 83.6%


Wind

Highest Gust 45.1km/h 16th


Mean Wind Speed 7.9km/h
Most Frequent Wind Direction East Southeast


Atmospheric Pressure

Highest Atmospheric Pressure 1031.3hPa 23rd
Lowest Atmospheric Pressure 1008.4hPa 16th


Mean Atmospheric Pressure 1022.0hPa


Precipitation

Total Rainfall During February 2025 66.0 mm
Total Rainfall Since Last 01/09 335.3 mm


Highest 24 Hour Total 21.6 mm 9th


Rain Days 12 days
Thunderstorm Days 3 days
Hail Days 1 day


Rainfall Events

3/2/2025 0.5 mm Isolated Showers; Distant Thunder and Hail
5/2/2025 0.0 mm Distant Isolated Light Rain
6/2/2025 0.0 mm Distant Isolated Light Rain
7/2/2025 8.0 mm Rain Showers
8/2/2025 15.7 mm Rain Showers
9/2/2025 21.6 mm Steady Rain; Thunderstorm
10/2/2025 6.3 mm Rain Showers
14/2/2025 0.0 mm Distant Hailstorm with Large Hail
15/2/2025 2.3 mm Rain Showers
16/2/2025 0.5 mm Isolated Showers
19/2/2025 0.6 mm P.M. Isolated Showers
20/2/2025 4.2 mm A.M. Showers; Distant Steady Heavy Rain
22/2/2025 1.3 mm A.M. Isolated Shower
26/2/2025 2.1 mm P.M. Light Rain; Showers; Distant Thunder
27/2/2025 2.9 mm Showers; Distant Hail


February 2025 Compared to the Climate Means

  Climate Mean February 2025 Anomaly
Mean Maximum Temperature 15.6°C 17.1°C  +1.5°C
Mean Minimum Temperature 9.7°C 10.0°C +0.3°C
Mean Temperature 12.7°C 13.5°C +0.8°C
Mean Relative Humidity 78.3% 83.6% -5.3%
Mean Atmospheric Pressure 1020.2hPa 1022.0hPa +1.8hPa
Total Rainfall 61.9 mm 66.0 mm +4.1 mm
Total Rainfall Since Last 01/09 447.4 mm 335.3 mm -112.1 mm
Total Rain Days 11 days 12 days +1 day
Total Thunderstorm Days 3 days 3 days /
Total Hail Days 2 days 1 day -1 day


February 2025 – Rainfall Totals Bounce Back

The 66.0 mm of precipitation measured at our weather station in Gozo was marginally above the climate norm for February. Whilst all corners of the Maltese Islands registered a wetter than average February 2025, it was the island of Malta which benefitted most from the rainfall recovery. Localities in Malta received approximately 103.2 mm over the course of February 2025. Gozitan localities, on the other hand, received only 65.2 mm. This was due to the fact that most rain-bearing systems came to our islands with easterly currents. These affect Malta far more than Gozo. A case in point was the 20th. Maltese localities experienced continuous heavy rain in the morning. Gozo only received a few showers. More than half of all days last month; 15 in total, registered rainfall. The highlight was a hailstorm with large hailstones over the southern half of Malta, particularly Birżebbuġa and Għaxaq, on Valentine’s Day. February was the second wetter than average since last September 1st, along with February.

Temperatures were significantly warmer than average, particularly during the day. The mean maximum temperature of 17.1°C exceeded the norm by 1.5°C. Overall temperatures were  0.8°C above typical values for the time of year. Temperatures in winter depend on the so-called polar vortex. This is a circulation of very cold air in the Arctic. This winter we’ve seen the polar vortex assume a stronger and more compact structure, leading to cold air remaining locked up and restricted to polar areas. It was so strong, in fact, that the temperature at the level of 30,000 above the Arctic dropped to -90°C (the coldest for the past 40 years). This state of affairs is being maintained for now. When that happens, low pressure systems from over the Sahara Desert can reach us more freely, together with more frequent southeasterly winds and warmer than average temperatures. The difference from the climate norm with minimum temperatures was of only 0.3°C. This was thanks to a number of chilly nights brought about by numerous calm and clear nights, the coldest of which was the dawn of the 23rd when the mercury dipped to 5.8°C!

Winds were weaker than normal, with less gales than normal. Atmospheric pressure averaged 1022hPa. This is stronger than normal.

Rainfall Totals around the Maltese Islands in February 2025 (and since last September 1st):

Kerċem: 66.0 mm (335.3 mm)

Victoria: 66.1 mm (339.0 mm)

Marsalforn: 63.7 mm (286.8 mm)

Xewkija: 58.6 mm (232.1 mm)

Nadur: 70.3 mm (326.2 mm)

Għajnsielem: 66.4 mm (282.0 mm)

Mellieħa: 64.6 mm (258.1 mm)

Buġibba: 77.1 mm (260.0 mm)

Mġarr: 104.7 mm (331.1 mm)

Naxxar: 98.6 mm (351.3 mm)

Mosta: 95.9 mm (343.7 mm)

Dingli: 132.4 mm (431.9 mm)

Pembroke: 100.8 (349.2 mm)

Msida: 109.6 mm (425.3 mm)

Sliema: 87.7 mm (328.2 mm)

Valletta: 103.1 mm (351.1 mm)

Fgura: 108.2 mm (412.8 mm)

Żejtun: 115.0 mm (363.9 mm)

Żabbar: 151.6 mm (426.3 mm)

Imqabba: 102.0 mm (384.3 mm)

Siġġiewi: 115.7 mm (359.2 mm)

Żurrieq: 99.8 mm (346.5 mm)

Marsaxlokk: 86.7 mm (285.9 mm)

NATIONAL MEAN: 91.9 mm (338.2 mm)

End of Month Reports

Springtime Temperatures in January 2025

Air Temperature

Highest Maximum 19.5°C 26th
Lowest Maximum 12.9°C 14th
Highest Minimum 14.7°C 10th
Lowest Minimum 5.6°C 16th


Mean Maximum 17.5°C
Mean Minimum 11.7°C
Mean 14.6°C


Relative Humidity

Highest Relative Humidity 94% Numerous days
Lowest Relative Humidity 57% 18th


Mean Relative Humidity 81.7%


Wind

Highest Gust 53.1km/h 17th


Mean Wind Speed 11.1km/h
Most Frequent Wind Direction Northwest


Atmospheric Pressure

Highest Atmospheric Pressure 1031.4hPa 1st
Lowest Atmospheric Pressure 1008.4hPa 12th


Mean Atmospheric Pressure 1020.1hPa


Precipitation

Total Rainfall During January 2025 52.8 mm
Total Rainfall Since Last 01/09 269.3 mm


Highest 24 Hour Total 12.3 mm 13th


Rain Days 8 days
Thunderstorm Days 3 days
Hail Days 1 day


Rainfall Events

2/1/2025 0.0 mm Distant Isolated Light Rain
3/1/2025 0.0 mm Distant Isolated Showers
4/1/2025 0.0 mm Distant Isolated Showers
8/1/2025 0.8 mm Light Rain
12/1/2025 3.5 mm A.M. Shower
13/1/2025 12.3 mm P.M. Heavy Rain
14/1/2025 10.1 mm Showers; Distant Thunder
15/1/2025 1.0 mm P.M. Shower
16/1/2025 6.2 mm A.M. Isolated Shower; P.M. Steady Rain
17/1/2025 10.2 mm A.M. Steady Rain; P.M. Thunderstorm with Hail
18/1/2025 0.0 mm Distant Light Rain
20/1/2025 0.0 mm Distant Isolated Showers
21/1/2025 0.0 mm Distant Isolated Showers
29/1/2025 8.7 mm Light to Moderate Rain; Distant Thunder
30/1/2025 0.0 mm Distant A.M. Light Rain


January 2025 Compared to the Climate Means

  Climate Mean January 2025 Anomaly
Mean Maximum Temperature 15.6°C 17.5°C  +1.9°C
Mean Minimum Temperature 10.1°C 11.7°C +1.6°C
Mean Temperature 12.8°C 14.6°C +1.8°C
Mean Relative Humidity 78.4% 81.7% +3.3%
Mean Atmospheric Pressure 1021.7hPa 1020.1hPa -1.6hPa
Total Rainfall 69.4 mm 52.8 mm -16.6 mm
Total Rainfall Since Last 01/09 385.5 mm 269.3 mm -116.2 mm
Total Rain Days 14 days 8 days -6 days
Total Thunderstorm Days 4 days 3 days -2 days
Total Hail Days 2 days 1 day -2 day


Springtime Temperatures in January 2025

Almost half of all days (15) last January were characterized by at least one shower over one area or another of the Maltese Islands. Rain was measured at our weather station on eight of these. Thunder was heard on three of these while hail was recorded once. Despite these days of rain, January’s total precipitation of 63.0 mm was less than the value for a typical January. The total rainfall at our weather station was at an even lower 52.8 mm.

Apart from being drier than the climate norm, the month was also warmer than expected at this time of year. In fact, it was among the warmest Januarys ever. The mean temperature of 14.6°C exceeded the climate average by 1.8°C. This comprised a mean maximum temperature of 17.5°C (1.9°C warmer than average) and a mean minimum temperature of 11.7°C (1.6°C warmer than average). These temperatures are more typical of Easter time rather than the peak of winter! The maximum temperature of 19.5°C on January 26th was far from breaking absolute temperature records, however. A calm and clear night on the 16th accounted for the month’s coldest minimum temperature of 5.6°C.

Rainfall Totals around the Maltese Islands in January 2025 (and since last September 1st):

Kerċem: 52.8 mm (269.3 mm)

Victoria: 52.2 mm (272.9 mm)

Marsalforn: 51.5 mm (223.1 mm)

Xewkija: 55.7 mm (173.5 mm)

Nadur: 51.6 mm (255.9 mm)

Għajnsielem: 67.5 mm (215.6 mm)

Mellieħa: 67.0 mm (193.5 mm)

Buġibba: 52.6 mm (182.9 mm)

Mġarr: 70.1 mm (226.4 mm)

Naxxar: 68.1 mm (252.7 mm)

Mosta: 62.0 mm (247.8 mm)

Dingli: 101.1 mm (299.5 mm)

Pembroke: 64.0 mm (248.2 mm)

Msida: 75.3 mm (315.7 mm)

Sliema: 68.4 mm (240.5 mm)

Valletta: 61.6 mm (248.0 mm)

Fgura: 72.1 mm (304.6 mm)

Żejtun: 53.7 mm (248.9 mm)

Żabbar: 62.5 mm (274.7 mm)

Imqabba: 80.9 mm (282.3 mm)

Siġġiewi: 68.2 mm (243.5 mm)

Żurrieq: 63.2 mm (246.7 mm)

Marsaxlokk: 47.4 mm (199.2 mm)

NATIONAL MEAN: 63.0 mm (246.3 mm)

End of Month Reports

Significantly Drier than Average in December 2024

Air Temperature

Highest Maximum 22.8°C 14th
Lowest Maximum 13.2°C 24th and 25th
Highest Minimum 17.6°C 13th
Lowest Minimum 6.3°C 31st


Mean Maximum 17.8°C
Mean Minimum 11.7°C
Mean 14.7°C


Relative Humidity

Highest Relative Humidity 94% Numerous days
Lowest Relative Humidity 42% 11th


Mean Relative Humidity 74.9%


Wind

Highest Gust 62.8km/h 24th


Mean Wind Speed 12.7km/h
Most Frequent Wind Direction Northwest


Atmospheric Pressure

Highest Atmospheric Pressure 1034.0hPa 17th
Lowest Atmospheric Pressure 1003.7hPa 24th


Mean Atmospheric Pressure 1019.9hPa


Precipitation

Total Rainfall During December 2024 31.8 mm
Total Rainfall Since Last 01/09 216.5 mm


Highest 24 Hour Total 8.4 mm 27th


Rain Days 14 days
Thunderstorm Days 5 days
Hail Days 4 days


Rainfall Events

01/12/2024 TR mm Isolated Light Rain
03/12/2024 1.8 mm P.M. Isolated Thunderstorm
04/12/2024 5.9 mm A.M. and P.M. Isolated Thunderstorm
05/12/2024 3.4 mm Isolated Showers; Distant A.M. and P.M. Hailstorms
06/12/2024 0.0 mm Distant Isolated Showers
07/12/2024 0.8 mm Isolated Light Rain; Distant Isolated Showers
08/12/2024 0.5 mm Isolated Light Rain; Distant Isolated Showers
15/12/2024 3.9 mm P.M. Rain/Hail Showers; Distant Thunder
16/12/2024 0.5 mm A.M. Light Rain; Distant Thundery Rain/Hail Showers
20/12/2024 0.3 mm Isolated Showers
21/12/2024 0.2 mm Isolated Showers
22/12/2024 0.5 mm Isolated Showers
23/12/2024 3.3 mm Isolated Showers with Hail; Distant Hailstorms and Thunder
24/12/2024 0.3 mm Light Rain; Distant Isolated Showers
25/12/2024 0.0 mm Distant P.M. Isolated Showers
26/12/2024 1.9 mm P.M. Isolated Showers
27/12/2024 8.5 mm A.M. Isolated Showers
28/12/2024 0.0 mm Distant Light Rain
30/12/2024 TR mm Dew


December 2024 Compared to the Climate Means

  Climate Mean December 2024 Anomaly
Mean Maximum Temperature 17.2°C 17.8°C  +0.6°C
Mean Minimum Temperature 11.9°C 11.7°C -0.2°C
Mean Temperature 14.5°C 14.7°C +0.2°C
Mean Relative Humidity 78.9% 74.9% -5.0%
Mean Atmospheric Pressure 1018.0hPa 1019.9hPa +1.9hPa
Total Rainfall 83.0 mm 31.8 mm -51.2 mm
Total Rainfall Since Last 01/09 316.1 mm 216.5 mm -99.6 mm
Total Rain Days 13 days 14 days +1 day
Total Thunderstorm Days 3 days 5 days +2 days
Total Hail Days 2 days 4 days +2 days


Significantly Drier than Average in December 2024

December 2024 became the tenth consecutive drier-than-average December. With a measly 31.8 mm measured over the course of the month, December brought with it far less than half the climate norm. December used to be the year’s wettest month. The national mean stood at a similar 34.2 mm. There were 14 days of rain at our weather station. Thunder was heard on 5 days while hail was recorded on 4 days. Nationally, there were 18 days when at least one shower was measured in one part or another of the island. That is a staggering amount, when considering that rainfall totals were so poor. This is because rain came from isolated showers rather than extensive, widespread rain-bearing low pressure systems.

Mean atmospheric pressure stood at 1019.9hPa. This is higher than average and could be explained by the constant close proximity of an anticyclone.

December 2024 was overall slightly warmer than the norm. The mean temperature of 14.7°C was 0.2°C above the norm. This comprised a mean maximum temperature of 17.8°C which was 0.6°C  above the climatic mean and a mean minimum temperature of 11.7°C which was 0.2°C  below the norm. This wide range in anomalies could be explained by the temperature variations on days under anticyclonic influence. On days with fine weather, days were warm but nights were cold. The 11th, with a 20.1°C maximum (2.9°C warmer than average) and a 7.6°C minimum (4.3°C colder than average), was one of these various instances. With a mean temperature of 11.2°C, Christmas Eve was December’s coldest day overall. Christmas Eve and Christmas Day shared the title for the lowest maximum temperature. At 13.2°C, it is also the lowest maximum temperature for the whole of 2024. New Year’s Eve, on the other hand, was the month’s coldest night. The mercury dipped to 6.3°C that night.

As expected, December was a windswept month. The wind, from a predominantly Northwest direction, reached at least Force 6 on almost half of all days. The windiest days were those just before Christmas Day. The highest wind gust registered was of 62.8 km/h on the 24th.

Rainfall Totals around the Maltese Islands in December 2024 (and since last September 1st):

Kerċem: 31.8 mm (216.5 mm)

Victoria: 32.8 mm (220.7 mm)

Marsalforn: 22.9 mm (171.6 mm)

Xewkija: 22.9 mm (117.8 mm)

Nadur: 25.5 mm (204.3 mm)

Għajnsielem: 32.9 mm (148.1 mm)

Mellieħa: 17.7 mm (126.5 mm)

Buġibba: 14.0 mm (130.3 mm)

Mġarr: 31.2 mm (156.3 mm)

Naxxar: 24.4 mm (184.6 mm)

Mosta: 23.8 mm (185.8 mm)

Dingli: 40.2 mm (198.4 mm)

Pembroke: 24.8 mm (184.4 mm)

Msida: 52.5 mm (240.4 mm)

Sliema: 35.1 mm (172.1 mm)

Valletta: 43.0 mm (186.4 mm)

Fgura: 51.4 mm (232.5 mm)

Żejtun: 44.9 mm (195.2 mm)

Żabbar: 44.0 mm (212.2 mm)

Imqabba: 51.7 mm (201.4 mm)

Siġġiewi: 50.3 mm (175.3 mm)

Żurrieq: 48.1 mm (183.5 mm)

Marsaxlokk: 37.1 mm (151.8 mm)

NATIONAL MEAN: 34.2 mm (183.3 mm)

End of Month Reports

A Warmer but Wetter November 2024

Air Temperature

Highest Maximum 25.0°C 6th
Lowest Maximum 18.1°C 11th
Highest Minimum 19.1°C 7th
Lowest Minimum 9.1°C 25th


Mean Maximum 21.9°C
Mean Minimum 15.2°C
Mean 18.6°C


Relative Humidity

Highest Relative Humidity 95% Numerous days
Lowest Relative Humidity 50% 23rd


Mean Relative Humidity 78.6%


Wind

Highest Gust 46.7km/h 30th


Mean Wind Speed 7.0km/h
Most Frequent Wind Direction West Northwest


Atmospheric Pressure

Highest Atmospheric Pressure 1035.1hPa 24th
Lowest Atmospheric Pressure 1011.5hPa 21st


Mean Atmospheric Pressure 1021.3hPa


Precipitation

Total Rainfall During November 2024 131.3 mm
Total Rainfall Since Last 01/09 184.7 mm


Highest 24 Hour Total 33.1 mm 11th


Rain Days 10 days
Thunderstorm Days 6 days
Hail Days 0 days


Rainfall Events

06/11/2024 0.0 mm Distant Localized Shower
07/11/2024 0.5 mm A.M. Light Rain; Distant P.M. Steady Rain
08/11/2024 20.3 mm A.M. Steady Rain; Isolated Thunderstorms
09/11/2024 20.5 mm A.M. Heavy Rain Showers
10/11/2024 18.3 mm Heavy Rain Showers; Isolated Thunderstorms
11/11/2024 33.1 mm Heavy Rain; Isolated Thunderstorms
12/11/2024 22.2 mm Heavy Rain Showers; Isolated Thunderstorms
13/11/2024 3.3 mm A.M. Isolated Showers
15/11/2024 2.6 mm A.M. Isolated Thunderstorms
21/11/2024 0.0 mm Distant Isolated Showers
27/11/2024 0.2 mm Isolated Light Rain; Distant Isolated Showers
29/11/2024 0.0 mm Distant P.M. Isolated Showers
30/11/2024 10.3 mm Showers; Distant Isolated Thunderstorms


November 2024 Compared to the Climate Means

  Climate Mean November 2024 Anomaly
Mean Maximum Temperature 20.9°C 21.9°C  +1.0°C
Mean Minimum Temperature 15.2°C 15.2°C /
Mean Temperature 18.0°C 18.6°C +0.6°C
Mean Relative Humidity 77.6% 78.6% +1.0%
Mean Atmospheric Pressure 1016.3hPa 1021.3hPa +7.0hPa
Total Rainfall 94.2 mm 131.3 mm +37.1 mm
Total Rainfall Since Last 01/09 233.1 mm 184.7 mm -48.4 mm
Total Rain Days 11 days 10 days -1 day
Total Thunderstorm Days 5 days 6 days +1 day
Total Hail Days 1 day 0 days -1 day


A Warmer but Wetter November 2024

November brought a long-standing pattern of drier than average months to an end. With a total of 131.3 mm of rainfall measured at our Gozo weather station, November 2024 was the first month since February 2023 to bring significant rainfall to our islands. The national mean stood at a lower 94.4 mm, but was still on part with the climate norm. This rain was spread over 10 days, with the vast majority of it falling in a cluster from the 8th till the 13th due to instability being locked over the central Mediterranean. Apart from a few days with light rain, the only other day with significant precipitation was the 30th. No extreme rainfall events were recorded, although some brief flooding was observed from a handful of downpours.

November 2024 was warmer than the norm, particularly were maximum temperatures are concerned. The mean temperature of 18.6°C was 0.6°C above the norm. The mean maximum temperature of 21.9°C was 1°C  above the climatic mean. The mean minimum temperature of 15.2°C, on the other hand, equalled the average. There was only one night with a minimum temperature below 10°C (9.1°C on the 25th), and this was due to the trailing edge of a mass of cold air touching the central Mediterranean briefly. The rest of the month was marked by a lack of flow of colder air from northern latitudes towards the Mediterranean.

November was a much calmer month than expected at this time of year. There were only two episodes of strong wind; one on the 22nd and 23rd, and the other on the 30th. The one on the 30th accounted for the month’s highest wind gust. This stood at 61.1km/h (Force 8) from a Westerly direction.

Rainfall Totals around the Maltese Islands in November 2024 (and since last November 1st):

Kerċem: 131.3 mm (190.2 mm)

Victoria: 130.9 mm (194.5 mm)

Xewkija: 67.0 mm (101.4 mm)

Nadur: 125.2 mm (186.7 mm)

Marsalforn: 105.4 mm (155.5 mm)

Mellieħa: 60.2 mm (109.6 mm)

Buġibba: 61.7 mm (117.4 mm)

Mġarr: 90.2 mm (129.1 mm)

Naxxar: 88.6 mm (164.1 mm)

Mosta: 91.3 mm (166.9 mm)

Dingli: 124.7 mm (162.0 mm)

Msida: 92.5 mm (189.7 mm)

Valletta: 74.1 mm (145.5 mm)

Imqabba: 108.4 mm (153.2 mm)

Birżebbuġa: 78.5 mm (115.2 mm)

Sliema: 68.3 mm (138.4 mm)

Fgura: 92.1 mm (183.9 mm)

NATIONAL MEAN: 94.4 mm (152.6 mm)

End of Month Reports

A Very Warm and Dry October 2024

Air Temperature

Highest Maximum 29.3°C 3rd
Lowest Maximum 23.6°C 31st
Highest Minimum 24.3°C 3rd
Lowest Minimum 15.2°C 30th


Mean Maximum 26.1°C
Mean Minimum 18.7°C
Mean 22.4°C


Relative Humidity

Highest Relative Humidity 95% Numerous days
Lowest Relative Humidity 52% 12th


Mean Relative Humidity 78.6%


Wind

Highest Gust 53.1km/h 19th


Mean Wind Speed 8.0km/h
Most Frequent Wind Direction South Southeast


Atmospheric Pressure

Highest Atmospheric Pressure 1028.0hPa 24th
Lowest Atmospheric Pressure 1007.2hPa 3rd


Mean Atmospheric Pressure 1018.8hPa


Precipitation

Total Rainfall During October 2024 23.7 mm
Total Rainfall Since Last 01/09 53.4 mm


Highest 24 Hour Total 22.4 mm 19th


Rain Days 3 days
Thunderstorm Days 2 days
Hail Days 0 days


Rainfall Events

18/10/2024 0.5 mm Light Rain Shower
19/10/2024 22.4 mm Thunderstorm
22/10/2024 1.0 mm Light Rain Shower; Distant Thunderstorm


October 2024 Compared to the Climate Means

  Climate Mean October 2024 Anomaly
Mean Maximum Temperature 24.9°C 26.1°C  +1.2°C
Mean Minimum Temperature 18.5°C 18.7°C +0.2°C
Mean Temperature 21.7°C 22.4°C +0.7°C
Mean Relative Humidity 77.7% 78.6% +0.9%
Mean Atmospheric Pressure 1017.8hPa 1018.8hPa +1.0hPa
Total Rainfall 84.0 mm 23.7 mm -60.3 mm
Total Rainfall Since Last 01/09 138.9 mm 53.4 mm -85.5 mm
Total Rain Days 10 days 3 days -7 days
Total Thunderstorm Days 6 days 2 days -4 days
Total Hail Days 1 day 0 days -1 day


A Very Warm and Dry October 2024

October brought generally dry warm weather to the Maltese Islands.

Having produced just 9.4 mm of precipitation, October was significantly drier than the climate norm, which stands at 84.0 mm of rainfall. This was the third consecutive year with a very dry October. It was also one of the driest on record. There was only one major rainfall event. After a day of near misses, an evening downpour on the 19th struck the northern half of Gozo with up to 70 mm in the villages of San Lawrenz and Għarb. Surrounding localities also received a decent share of rain. 22.4 mm were measured by our rain gauge in Kerċem. There were two other days with rain, both yielding only light rain showers. Thunderstorms drifted past on one of these occasions. Localities across Malta received no heavy rainfall at all.

October 2024 was also significantly warmer than average, registering a mean temperature of 22.4°C which exceeded the climate norm by 0.7°C. A staggering twenty-six days in October registered maximum temperatures that were higher than the norm. An extensive area of high pressure (anticyclone) prevailed over eastern Europe and the Mediterranean. Troughs of low pressure (storm systems) remained stuck over the western Mediterranean and northwestern Europe. This helped maintain a persistent easterly air flow across the central Mediterranean. Apart from making October the second consecutive month with the South Southeast as the predominant wind direction, it ensured that warm air was constantly advected from regions of the Sahara towards the central Mediterranean.

October was a much calmer month than expected at this time of year, with the wind speed averaging at 8.0 km/h rather than the norm of around 13.7 km/h. October’s maximum wind gust measured 53.1 km/h (Force 7) and blew from the Southeast in the morning of the 19th, ahead of the evening downpour.

Rainfall Totals around the Maltese Islands in October 2024 (and since last October 1st):

Kerċem: 23.7 mm (53.4 mm)

Victoria: 22.6 mm (57.0 mm)

Xewkija: 7.5 mm (31.8 mm)

Nadur: 21.8 mm (53.6 mm)

Marsalforn: 16.6 mm (43.3 mm)

Mellieħa: 6.8 mm (48.6 mm)

Buġibba: 3.0 mm (54.6 mm)

Mġarr: 9.7 mm (34.9 mm)

Naxxar: 5.0 mm (71.6 mm)

Mosta: 5.9 mm (70.7 mm)

Dingli: 5.5 mm (33.5 mm)

Msida: 4.9 mm (95.4 mm)

Valletta: 4.6 mm (69.3 mm)

Imqabba: 4.6 mm (41.3 mm)

Birżebbuġa: 5.3 mm (36.2 mm)

Sliema: 6.2 mm (68.7 mm)

Fgura: 6.0 mm (89.0 mm)

NATIONAL MEAN: 9.4 mm (56.1 mm)